
Graphical Monthly Summaries of My Home Voltage Measurements
Long page!
What follows are separate charts for each month of 2022 showing the thousands of voltage measurements I have made at my wall outlet of the too much voltage delivered to my home and appliances by Hydro One, Ontario. The measurement methodology is explained here.
If you have questions or comments about any of the information here, please contact me.
January 2022

The chart above shows the history of the voltage during the month of January. The average voltage over the month was 121.62 VAC, and the voltage was greater than the nominal 120 VAC 83.69% of the time, based on 8,922 measurements. It is discouraging how the voltage and its variability will seem to get better for a few weeks or months and then it gets worse again for a few weeks or months, and then again ...
As a result of the lower average voltage coupled with the wider variations in voltage, there were 41 Under-Voltage Events (momentary voltage less than 110 VAC) during the month of June, and by comparison only 2 Over-Voltage Events (momentary voltage greater than 127 VAC).
The average voltage during each 5-minute recording period is shown in the chart above by a black line; the maximum voltage recorded during each recording period is shown by a red line, and the minimum voltage is shown by a yellow line. The green line in the chart is the nominal voltage of 120 VAC.

The histogram above shows the statistical distribution of average voltage measurements for the whole month.

The chart above shows all of the voltage measurements according to the time of day when they were taken during the month.
The chart below shows the average of all of those measurements, according to the time of day when they were taken, and gives a more concise picture of the electrical regulation of the voltage during each day.

February 2022

The chart above shows the history of the voltage during the month of February. The average voltage over the month was 121.40 VAC, and the voltage was greater than the nominal 120 VAC 81.64% of the time, based on 8,060 measurements. In recent months the average voltage has been gradually decreasing, and certainly during the latter part of this month the daily variability in the voltage has seemed somewhat reduced. One sincerely hopes that this is a trend.

The histogram above shows the statistical distribution of average voltage measurements for the whole month.

The chart above shows all of the voltage measurements according to the time of day when they were taken during the month.
The chart below shows the average of all of those measurements, according to the time of day when they were taken, and gives a more concise picture of the electrical regulation of the voltage during each day.

March 2022

The chart above shows the history of the voltage during the month of March. The average voltage over the month was 121.84 VAC, and the voltage was greater than the nominal 120 VAC 89.37% of the time, based on 8,911 measurements. During the latter half of this month, the daily variability in the voltage has seemed somewhat reduced. One sincerely hopes that this is a trend.

The histogram above shows the statistical distribution of average voltage measurements for the whole month.

The chart above shows all of the voltage measurements according to the time of day when they were taken during the month.
The chart below shows the average of all of those measurements, according to the time of day when they were taken, and gives a more concise picture of the electrical regulation of the voltage during each day.

April 2022

The chart above shows the history of the voltage during the month of April. The average voltage over the month was 122.04 VAC, and the voltage was greater than the nominal 120 VAC 88.99% of the time, based on 8,635 measurements. Early on the morning of 07 April, there were three consecutive 5-minute periods during which the instantaneous voltage exceeded 127 VAC (127.5, 128.0, 127.2 VAC). During the 4:00 p.m. hour of 15 April, there were three under-voltage events and one over-voltage event. In this latter case the voltage rose momentarily to 133.8 VAC. Most notably, beginning at 7:30 a.m. on 28 April, the voltage was reduced by 4 volts.

The histogram above shows the statistical distribution of average voltage measurements for the whole month.

The chart above shows all of the voltage measurements according to the time of day when they were taken during the month.
The chart below shows the average of all of those measurements, according to the time of day when they were taken, and gives a more concise picture of the electrical regulation of the voltage during each day.

May 2022

The chart above shows the history of the voltage during the month of May. The average voltage during the month was 119.11 VAC. The voltage was greater than the nominal 120 VAC about 49.66% of the time, based on 8,784 measurements. Early on the morning of 05 May, the voltage was significantly increased, undoing the reduction that had occurred late in April. Due to an unprecedented storm (a derecho), affecting southern and eastern Ontario, a major power outage began at my home around 3.45 p.m. on 21 May and power returned about 9 hours later. The aftermath of the storm resulted in much lower than normal voltages and wide variations in the voltage until most of the damage was repaired. Due to the outage, about 11 hours of data were lost, 9 of them when there was no voltage to measure.
Thanks to the line crews from Hydro One, Hydro Ottawa, and their colleagues from other areas for their hard and round-the-clock work in repairing damage and restoring service following the extreme weather event of 21 May.

The histogram above shows the statistical distribution of average voltage measurements for the whole month.

The chart above shows all of the voltage measurements according to the time of day when they were taken during the month. You can easily see the effect of the wide voltage variations during the month.
With the wide variations in voltage and multiple situations which existed during the month, there is little point in charting the average voltage at all times of day for the month of May 2022.
June 2022

The chart above shows the history of the voltage during the month of June. The average voltage during the month was 118.75 VAC. The voltage was greater than the nominal 120 VAC only 27.84% of the time, based on 8,604 measurements. Due to an unprecedented storm (a derecho) on 21 May, affecting southern and eastern Ontario, a major power outage of about 9 hours duration occurred in my neighbourhood. The aftermath of the storm resulted in much lower than normal voltages and wide variations in the voltage. Please note the extended scale for voltage in the chart above, to accommodate the wider variations in voltage.
As a result of the lower average voltage coupled with the wider variations in voltage, a number of Under-Voltage Events (voltage less than 110 VAC) occurred during the month of June, as well as a few Over-Voltage Events (voltage greater than 127 VAC).
Thanks to the line crews from Hydro One, Hydro Ottawa, and their colleagues from other areas for their hard and round-the-clock work in repairing damage and restoring service following the extreme weather event of 21 May.
The chart above also shows the approximately 2-hour power outage near mid-day on 18 June.

The histogram above shows the statistical distribution of average voltage measurements for the whole month. Note the wider voltage scale, to accommodate the greater range of voltages measured.

The chart above shows all of the voltage measurements according to the time of day when they were taken during the month. You can easily see the effect of the wider voltage variations during the month.

The chart above shows the average of all the voltage measurements at the times of day when the measurements were taken (every 5 minutes).
July 2022

The chart above shows the history of the voltage during the month of July. The average voltage during the month was 119.02 VAC. The voltage was greater than the nominal 120 VAC only 32.72% of the time, based on 8,923 measurements. Due to an unprecedented storm (a derecho) on 21 May, affecting southern and eastern Ontario, a major power outage of about 9 hours duration occurred in my neighbourhood. The aftermath of the storm resulted in much lower than normal voltages and wide variations in the voltage, which have continued through June and July.
Of course, the lower than normal voltage is not a bad thing, as the power and energy consumed by my appliances increases as the square of the applied voltage. So a lower voltage definitely results in less power and energy used, and my electricity bill benefits from this.
The average voltage during each 5-minute recording period is shown in the chart above by a black line; the maximum voltage recorded during each recording period is shown by a red line, and the minimum voltage is shown by a yellow line. The green line in the chart is the nominal voltage of 120 VAC. Our measurement methodology is explained here.

The histogram above shows the statistical distribution of average voltage measurements for the whole month. Note the wider voltage scale, to accommodate the greater range of voltages measured.

The chart above shows all of the voltage measurements according to the time of day when they were taken during the month. You can easily see the effect of the wider voltage variations during the month.

The chart above shows the average of all the voltage measurements at the times of day when the measurements were taken (every 5 minutes).
August 2022

The chart above shows the history of the voltage during the month of August. The average voltage during the month was 119.50 VAC, slightly higher than during July. The voltage was greater than the nominal 120 VAC only 39.29% of the time, based on 8,920 measurements. Due to an unprecedented storm (a derecho) on 21 May, affecting southern and eastern Ontario, a major power outage of about 9 hours duration occurred in my neighbourhood. The aftermath of the storm resulted in much lower than usual voltages and wide variations in the voltage, which have continued through June and July and into August.
Of course, the lower than usual voltage is not a bad thing, as the power and energy consumed by my appliances increases as the square of the applied voltage. So a lower voltage definitely results in less power and energy used, and my electricity bill benefits from this.

The histogram above shows the statistical distribution of average voltage measurements for the whole month. Note the wider voltage scale, to accommodate the greater range of voltages measured.

The chart above shows all of the voltage measurements according to the time of day when they were taken during the month. You can easily see the effect of the wider voltage variations during the month.

The chart above shows the average of all the voltage measurements at the times of day when the measurements were taken (every 5 minutes).
September 2022

The chart above shows the history of the voltage during the month of August. The average voltage during the month was 120.58 VAC, about one volt higher than during August. The voltage was greater than the nominal 120 VAC only 61.25% of the time, based on 8,635 measurements.

The histogram above shows the statistical distribution of average voltage measurements for the whole month. Note the wider voltage scale, to accommodate the greater range of voltages measured.

The chart above shows all of the voltage measurements according to the time of day when they were taken during the month. You can easily see the effect of the wider voltage variations during the month.

The chart above shows the average of all the voltage measurements at the times of day when the measurements were taken (every 5 minutes). You can easily see how the voltage is generally lowest during the daytime and highest at night.
October 2022

The chart above shows the history of the voltage during the month of October. The average voltage during the month was 120.99 VAC, about one volt higher than during August. The voltage was greater than the nominal 120 VAC 72.97% of the time, based on 8,921 measurements.

The histogram above shows the statistical distribution of average voltage measurements for the whole month. Note the wider voltage scale, to accommodate the greater range of voltages measured.

The chart above shows all of the voltage measurements according to the time of day when they were taken during the month. The black dots (actually, small crosses) are the average voltage during that 5-minute measuring period, while the ed crosses are the maximum voltage during that period, and the blue crosses are the minimum voltage during that period.

The chart above shows the average of all the voltage measurements at the times of day when the measurements were taken (every 5 minutes). You can see how the voltage is generally lower during the daytime and higher at night.
November 2022

The chart above shows the history of the voltage during the month of November. The average voltage during the month was 121.57 VAC, more than one volt higher than during August. The voltage was greater than the nominal 120 VAC 90.79% of the time, based on 8,642 measurements.

The histogram above shows the statistical distribution of average voltage measurements for the whole month. Note the wider voltage scale, to accommodate the greater range of voltages measured.

The chart above shows all of the voltage measurements according to the time of day when they were taken during the month. The black dots (actually, small crosses) are the average voltage during that 5-minute measuring period, while the red crosses are the maximum voltage during that period, and the blue crosses are the minimum voltage during that period.

The chart above shows the average of all the voltage measurements at the times of day when the measurements were taken (every 5 minutes). You can see how the voltage is generally lower during the daytime and higher at night.
December 2022

The chart above shows the history of the voltage during the month of December. The average voltage during the month was 123.01 VAC, more than one volt higher than during August. The voltage was greater than the nominal 120 VAC 93.27% of the time, based on 8,905 measurements.
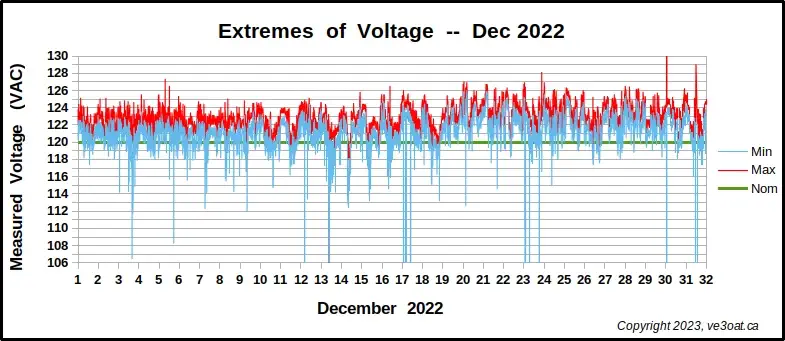
The chart above shows more clearly how often (often!) the voltage at my home exceeded the recommended maximum of 125 VAC and how often it fell below the recommended minimum of 110 VAC. The reasons for this lack of regulation of the delivered voltage are not known.

The histogram above shows the statistical distribution of average voltage measurements for the whole month. Note the wider voltage scale, to accommodate the greater range of voltages measured.

The chart above shows all of the voltage measurements according to the time of day when they were taken during the month. The black dots (actually, small crosses) are the average voltage during that 5-minute measuring period, while the red crosses are the maximum voltage during that period, and the blue crosses are the minimum voltage during that period.

The chart above shows the average of all the voltage measurements at the times of day when the measurements were taken (every 5 minutes). You can see how the voltage is generally lower during the daytime and higher at night. The effects on this average voltage of two "outages" (one by local work and the other by a power outage) are obvious.
Got Data?
If you have voltage measurements from your own neighbourhood and would like to share them, please contact me and I would be glad to exchange raw data and other results with you.