How I Measure the Voltage in My Home
Method Beginning November 2020
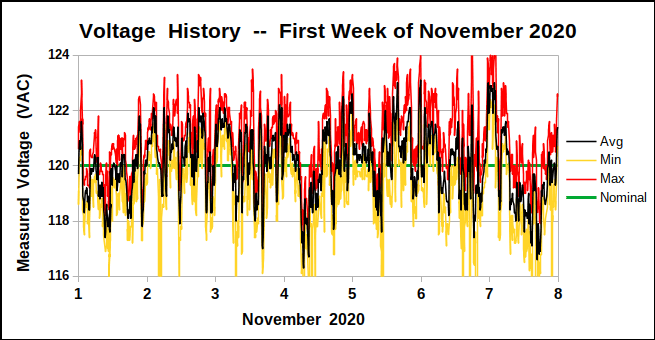
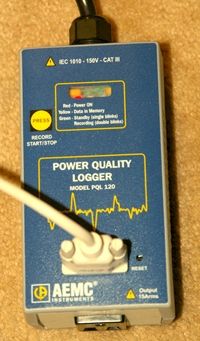
Continuing to use the AEMC Instruments model PQL-120 voltage recording device, which measures the RMS (root-mean-square) voltage 60 times each second, as discussed below, we are now recording three different voltages during each 5-minute recording period :
- the average of all the voltage measurements during the recording period, as before,
- the minimum voltage recorded during the recording period,
- the maximum voltage recorded during the recording period.
Note — During the period November 2020 to January 2021, voltage data was recorded using the PQL-120 monitor every 10 minutes. Beginning in February 2021 data is recorded each 5 minutes. This will result in about 8,000 readings per month, instead of only about 4,000.

The chart above shows an example of the three voltage readings. This data was recorded during the first week of November 2020. One can see that, while the maximum voltage is not that far above the nominal voltage (120 VAC) and while the average voltage is reasonably well-behaved, the minimum voltage sometimes shows alarming dips and sags, occasionally even going below 110 VAC.
Note that the "minimum" and "maximum" voltages recorded before this (prior to November 2020) were actually just the lowest and highest of the average (RMS) voltages recorded by the AEMC Instruments PQL-120 power quality monitor, not the actual instantaneous minimum and maximum values.
This new measurement program will lead to greater understanding of the behaviour of the voltage supplied to my residence by Hydro One than was obtained earlier by simply recording the average (RMS) voltage during each 5- or 10-minute period.
Method After Early January 2018

Beginning in early January, 2018, measurements are taken by an automatic voltage recording device, an AEMC Instruments model PQL-120 power quality logger. Basically, this device uses an analog-to-digital converter to sample the instantaneous voltage 128 times each cycle of the voltage waveform, that is, 7680 samples/second. From these samples, essential information is obtained about the characteristics and quality of the voltage being supplied. The bottom line is that the RMS (root-mean-square) of the voltage at my electrical outlets is measured 60 times per second.
On a practical level, use of the PQL-120 allows me to measure the voltage at my electrical outlets as follows :
- an "average" (RMS) voltage measurement is calculated and recorded every 10 minutes during the day and night;
- a pause in measurements of between a few minutes and one or two hours occurs each week when data is downloaded and checked and the device is reset;
- as before, all measurements are taken at the same electrical wall outlet;
- voltage measurements with this device have been found to be within ±0.2 volts AC of measurements with my digital voltmeters (DVMs) that were used before;
- the device records voltages to the nearest one-tenth of a volt RMS;
- data is transferred weekly by computer to a LibreOffice Calc spreadsheet, and results are compiled and reported monthly;
- averages (means) of all the measurements for each month are calculated to the nearest one-hundredth of a volt RMS.
This automated measurement method is considered much more accurate than the previous manual method as data sets for each month now generally comprise several thousand measurements (instead of only several hundred) taken at regular intervals (instead of irregularly). There are also no pauses in the taking of measurements due to absences from home, as the PQL device happily takes measurements whether I am present or not. It even has an internal battery to keep it operating during brief power outages. The only pauses in measurement taking are once per week while I download the recorded measurements, verify them, and reset the device for the next week.
Method before January 2018

Beginning in late 2015 and until the fourth week of January 2018, all measurements were taken manually using a digital voltmeter.
- measurements have been taken at more or less random times during the day and night (as a light sleeper, it was easy for me to take a few measurements each night, though not as often as during the day);
- measurements were generally taken less often than once per hour;
- all measurements were taken at the same electrical wall outlet;
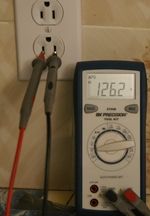
- all measurements were taken using the same two digital voltmeters (DVMs), a "Kill A Watt" model P4400 power monitor and a BK Precision model 2705B 3½-digit multimeter (pictured);
- these DVMs have been checked for consistency against my other voltmeters (I have several);
- voltages were recorded to the nearest one-tenth of a volt;
- all monthly data was compiled in a WordPerfect Office QuattroPro spreadsheet and treated the same as for other months;
- averages (means) for each month were calculated to the nearest one-hundredth of a volt, given that data sets for each month generally contain more than two hundred independent measurements.

