

Graphical Monthly Summaries of My Voltage Measurements
Long page!
What follows are separate charts for each month of 2020 showing the thousands of voltage measurements I have made at my wall outlet of the too much voltage delivered to my home and appliances by Hydro One, Ontario. The months are in reverse chronological order.
If you have questions or comments about any of the information here, please contact me.
December 2020

The chart above shows the history of the voltage during the month of December. The average voltage since the beginning of the month was 121.51 VAC. As you can see, however, the voltage increased significantly on 07 December but then tapered off, only to rise again near the end of the month. Since the 7th of the month the average voltage has been 121.86 VAC. Also, since 07 December, the voltage during the day seems much less variable than before, although there are hints of increasing variability near the end of the month. The voltage was greater than the nominal 120 VAC about 86.43% of the time, based on 4,459 measurements. The average voltage during each 10-minute recording period is shown in the chart below by a black line; the maximum voltage recorded during each recording period is shown by a red line, and the minimum voltage is shown by a yellow line. The green line in the chart is the nominal voltage of 120 VAC. Our new measurement methodology is explained here.
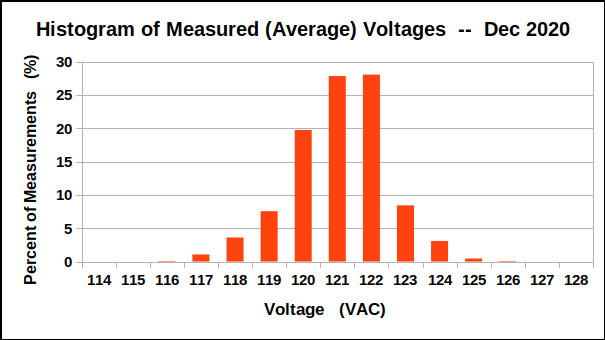
The histogram above shows the statistical distribution of voltage measurements for the whole month.

The chart above shows all of the voltage measurements according to the time of day when they were taken during the month. The general trend in voltage, hour by hour, is reduced from previous months, showing an improvement in the regulation or control of the voltage by Ontario's power generating system. The chart below shows the average of all of those measurements, according to the time of day when they were taken, and gives a more detailed picture of the electrical regulation of the voltage during each day.

From a consumer's point of view, proper regulation of the voltage is just as important as achieving a good daily or monthly average.
November 2020

The chart above shows the history of the voltage during the month of November. The average voltage for the month was 120.28 VAC, significantly lower than during several months prior to June and now very close to the nominal value. The voltage was greater than the nominal 120 VAC about 58.2% of the time, based on 4,300 measurements. It is notable that the voltage delivered by Hydro One has been fairly well-behaved since June and one hopes that this will continue. There was a scheduled power outage for several hours during the morning of 29 November, and data during the outage has been excluded from the chart abpve. The average voltage is shown in the chart by a black line; the maximum voltage recorded during any 10-minute recording period is shown by the red line, and the minimum voltage is shown by a yellow line. The green line in the chart is the nominal voltage of 120 VAC. Our new measurement methodology is explained here.
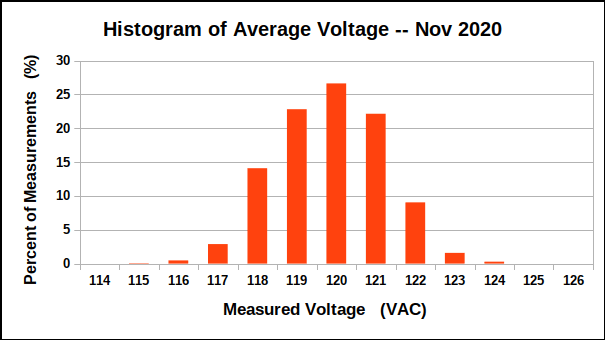
The histogram above shows the statistical distribution of voltage measurements for the whole month.

The chart above shows all of the voltage measurements according to the time of day when they were taken during the month. The general trend in voltage, hour by hour, is reduced from previous months, showing an improvement in the regulation or control of the voltage by Ontario's power generating system. The chart below shows the average of all of those measurements, according to the time of day when they were taken, and gives a more detailed picture of the electrical regulation of the voltage during each day.

From a consumer's point of view, proper regulation of the voltage is just as important as achieving a good daily or monthly average.
October 2020

The voltage was relatively well-behaved during October, with a calculated average of (I kid you not!) 120.002 VAC, a significant improvement over recent months. This is, of course, ideal. The daily variation in voltage was also reduced from recent months, now running about ±3 volts. Overall for the month of October, the voltage was more than the nominal voltage about 48.2% of the time, based on 4,461 measurements.

The histogram above shows the statistical distribution of voltage measurements for the whole month.

The chart above shows all of the voltage measurements according to the time of day when they were taken during October. The general trend in voltage, hour by hour, is reduced from previous months, showing an improvement in the regulation or control of the voltage by Ontario's power generating system. The chart below shows the average of all of those measurements, according to the time of day when they were taken, and gives a more detailed picture of the electrical regulation of the voltage during each day.

From a consumer's point of view, proper regulation of the voltage is just as important as achieving a good daily or monthly average.
September 2020
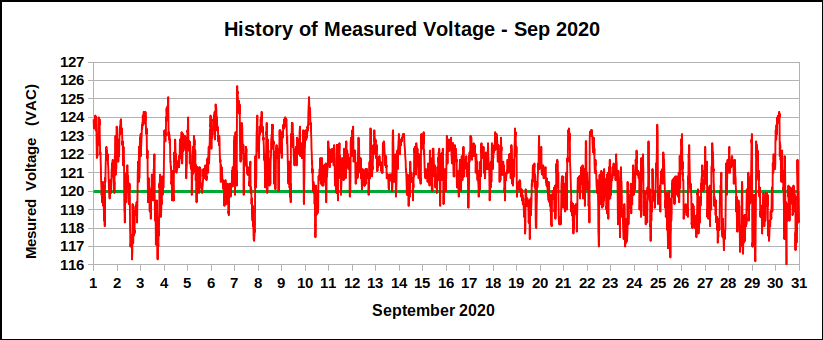
Several adjustments were made to the voltage during September and by month's end the average voltage was very close to the nominal 120 VAC, but the daily variations in voltage were about 8 volts (that is, about ± 4 volts). Overall for the month of September, the average was 120.89 VAC, based on 4,317 measurements. The voltage was higher than the nominal voltage of 120 VAC 71.46% of the time.
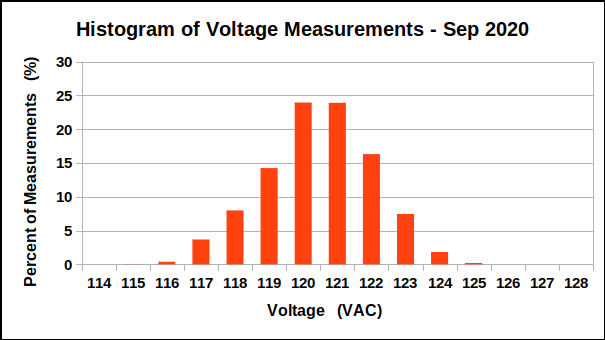
The histogram above shows the statistical distribution of voltage measurements for the whole month.

The chart above shows all of the voltage measurements according to the time of day when they were taken during September. The general trend in voltage, hour by hour, shows how poorly regulated is the voltage produced by Ontario's power generating system. And the chart below shows the average of all of those measurements, according to the time of day when they were taken.

While the average voltage for the month is not far from the nominal voltage that we all expect, the lack of control of the voltage causing wide excursions above and below the average is a serious problem. Proper regulation of the voltage is just as important as achieving a good daily or monthly average.
August 2020

Voltage during the month of August was dramatically different than during July. Overall for the month of August, the average was 120.66 VAC, ranging between 113.8 and 126.0 volts, based on 4,461 measurements. The voltage was higher than the nominal voltage of 120 VAC 62.0% of the time.
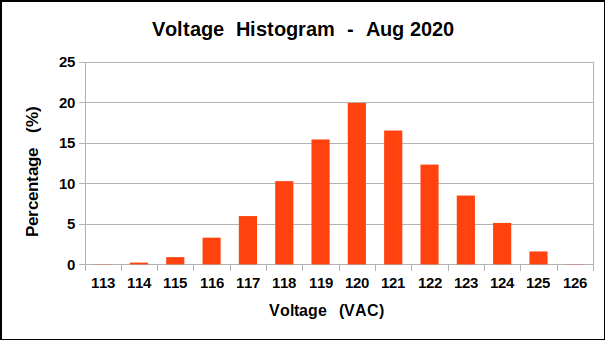
The histogram above shows the statistical distribution of voltage measurements for the whole month.
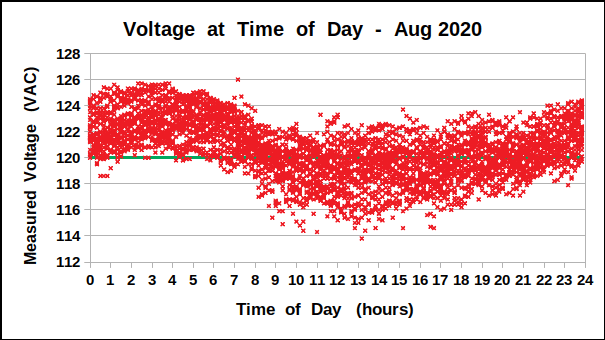
The chart above shows all of the voltage measurements according to the time of day when they were taken during August. The general trend in voltage, hour by hour, shows how poorly regulated is the voltage produced by Ontario's power generating system. And the chart below shows the average of all of those measurements, according to the time of day when they were taken. The lack of good voltage regulation is clearly evident.

While the average voltage for the month is close to the nominal voltage that we all expect, the lack of control of the voltage causing wide excursions above and below the average is a serious problem. Proper regulation of the voltage is just as important as achieving a good daily or monthly average.
July 2020

The voltage was much better behaved during July than in recent history, being kept generally in the range of 119-122 VAC. This is a huge improvement, and I congratulate Hydro One for their good management of the voltage supplied to my residence.
Overall for the month of July, the average was 120.62 VAC, ranging between 112.1 and 123.3 volts, based on 4,458 measurements. The voltage was higher than the nominal voltage of 120 VAC 73.1% of the time.

The histogram above shows the statistical distribution of voltage measurements for the whole month.
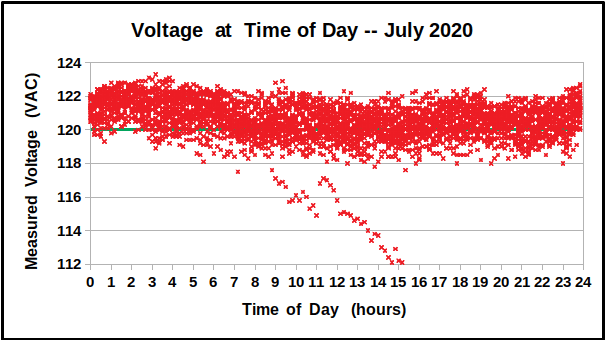
The chart above shows all of the voltage measurements according to the time of day when they were taken during July. And the chart below shows the average of all of those measurements, according to the time of day when they were taken.

June 2020

Like May before it, the month of June was "interesting" in that the voltage was significantly adjusted several times. There were two adjustments, first around 10:00 a.m. on 12 June and second around 2:50 p.m. on 22 June, resulting in three different voltage measurement "populations", as seen in the chart above. The average voltages during each of these three periods were :
- 1-12 June : 123.48 VAC
- 13-23 June : 117.35 VAC
- 23-30 June : 120.54 VAC
During this last period, the voltage was much better behaved with none of the wild variations in voltage that were seen before, and with an average voltage near the nominal voltage of 120.0 volts; a very satisfactory situation.
Overall for the month of June, the average was 120.61 VAC, ranging between 108.5 and 127.2 volts, based on 4,316 measurements. The voltage was higher than the nominal voltage of 120 VAC 64.39% of the time.

The histogram above shows the statistical distribution of voltage measurements for the whole month. Since the voltage was adjusted twice during the month, the histogram shows only the combined spread of these voltage populations.

The chart above shows all of the voltage measurements according to the time of day when they were taken during June. Again, the spread of voltages is the result of the combined two adjustments in the supplied voltage. And the chart below shows the average of all of those measurements, according to the time of day when they were taken.

The data presented here ignores a short power outage of a few minutes duration which occurred late in the day on 28 June.
May 2020

Like February, March, and April, the first week of May showed large daily variations in the voltage, varying between 122 and 128 VAC or more. Later weeks showed less daily variation, but there were four intentional adjustments in the supplied voltage, for unknown reasons. The average voltage for the month was 124.58 VAC. Overall, the voltage has been greater than the nominal 120 VAC almost one hundred percent of the time (99.53%), based on 4,455 measurements. The green line is the so-called nominal voltage of 120 VAC.

The histogram above shows the statistical distribution of voltage measurements for the whole month. Since the voltage was adjusted four times during the month, the histogram shows only the combined spread of these voltages.
Ideally, the voltage should be above 120 VAC only half of the time, and below 120 VAC the other half of the time. Clearly, this is not what is happening with the voltage delivered to my home by Ontario's Hydro One.

The diagram above shows all of the voltage measurements according to the time of day when they were taken during May. Again, the spread of voltages is the result of the combined four adjustments in the supplied voltage. And the diagram below shows the average of all of those measurements, according to the time of day when they were taken.

April 2020

Like February and March, April showed large variations in the voltage, varying almost daily between 122 and 128 VAC or more. The average was 124.99 VAC and the reason for the many variations is unknown but is symptomatic of poor voltage regulation in Hydro One's power generating system, particularly during the early morning hours. Overall, the voltage has been greater than the nominal 120 VAC one hundred percent of the time, based on 4,316 measurements. The green line is the so-called nominal voltage of 120 VAC.

The histogram above shows the statistical distribution of voltage measurements for the whole month. You can see the absolute absence of any measurements less than 120.6 VAC during the month. Ideally, the voltage should be above 120 VAC only half of the time, and below 120 VAC the other half of the time. Clearly, this is not what is happening with the voltage delivered to my home by Ontario's Hydro One.

The diagram above shows all of the voltage measurements according to the time of day when they were taken during April. And the diagram below shows the average of all of those measurements, according to the time of day when they were taken.

March 2020
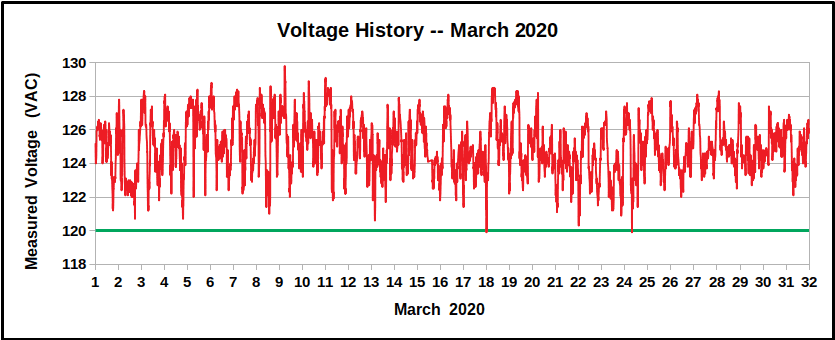
Like February and the end of January, March showed large variations in the voltage, varying almost daily between 122 and 128 VAC or more. The average was 125.02 VAC and the reason for the many variations is unknown but is symptomatic of poor voltage regulation in Hydro One's power generating system, particularly during the early morning hours. Overall, the voltage has been greater than the nominal 120 VAC about 99.96% of the time, based on 4,433 measurements.
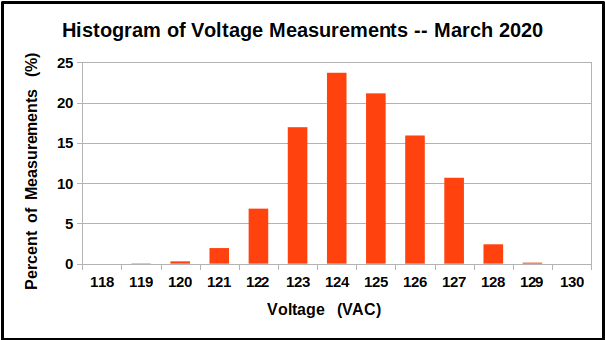
The histogram above shows the statistical distribution of voltage measurements for the whole month. You can see the absolute absence of any measurements less than 119.6 VAC during the month. Ideally, the voltage should be above 120 VAC only half of the time, and below 120 VAC the other half of the time. Clearly, this is not what is happening with the voltage delivered to my home by Ontario's Hydro One.

The diagram above shows all of the voltage measurements according to the time of day when they were taken during March.
February 2020

Like the end of January, February showed large variations in the voltage, varying daily between 120 and 128 VAC or more. The average was 124.72 VAC and the reason for the many variations is unknown but is symptomatic of poor voltage regulation, particularly during the early morning hours. Overall, the voltage has been greater than the nominal 120 VAC about 99.90% of the time, based on 4,172 measurements.

The histogram above shows the statistical distribution of voltage measurements for the whole month. You can see the absolute absence of any measurements less than 119.6 VAC during the month. Ideally, the voltage should be above 120 VAC only half of the time, and below 120 VAC the other half of the time. Clearly, this is not what is happening with the voltage delivered to my home by Ontario's Hydro One.

The diagram above shows all of the voltage measurements according to the time of day when they were taken during February.
The diagram below shows the average voltage at time of day for the whole month, and clearly shows the inconsistent voltage delivered during the early morning hours.

January 2020

Like some other months, January was a mix of several kinds of voltage behaviour. Until 6 January, the voltage was relatively well-behaved (stable) although elevated around 124 volts, but then became much more variable, with rather wide variations during each day. After the 13th, the voltage fell and was more stable again for several days, after which it became much more variable again. The reason for these sudden changes in behaviour are not known. Overall, the voltage has been greater than the nominal 120 VAC about 99.98% of the time, based on 4,460 measurements.
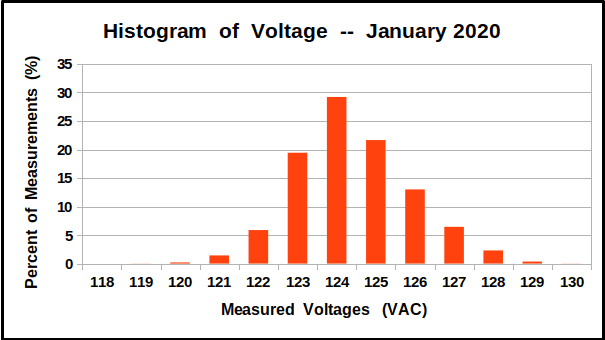
The histogram above shows the statistical distribution of voltage measurements for the whole month, so is a mix of the several voltage behaviours. You can see the absolute absence of any measurements less than 119.9 VAC during the month. Ideally, the voltage should be above 120 VAC only half of the time, and below 120 VAC the other half of the time. Clearly, this is not what is happening with the voltage delivered to my home by Ontario's Hydro One.

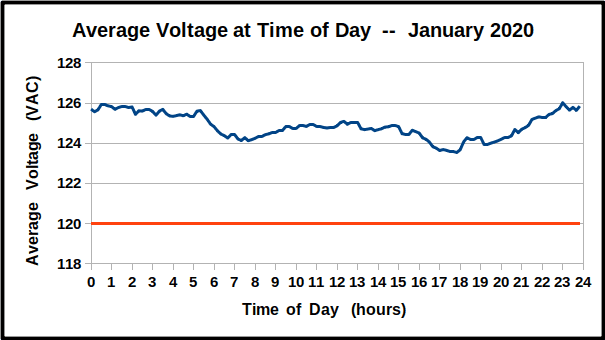
The diagram above shows all of the voltage measurements according to the time of day when they were taken during December. This, too, is a mix of the different voltage behaviours experienced during January.
The diagram below shows the average voltage at time of day for the whole month.
Got Data?
If you have voltage measurements from your own neighbourhood and would like to share them, please contact me and I would be glad to exchange raw data and other results with you.