

Total Harmonic Distortion (THD) Measurements at Home
Table of Contents –
- Measuring Distortion in the Power Line Voltage Waveform
- Distortion in the Hydro One Voltage
- THD During April 2018
- THD During January 2019
- THD During First Week of May 2022
- THD During Second Week of October 2022
- THD During Two Weeks in January 2023
- Hydro One's Specified Limits of THD
1. Measuring Distortion in the Power Line Voltage Waveform
It is easy to assume that the waveform of the voltage delivered by our electrical utilities is a pure sinusoidal wave, without any distortion due to imbalance in the generating system or the effects of nearby non-linear loads. In reality, the voltage waveform usually has some distortion, measured most often as the sum of harmonics of the power line frequency. A convenient unit to express the effective distortion at any time is as a percentage of Total Harmonic Distortion (THD) of the power line voltage waveform compared to an undistorted (pure sine wave) waveform.
Five times, using my AEMC PQL-120 instrument, I have measured the total harmonic distortion (THD) of the voltage waveform delivered to my home by Hydro One (Ontario). The first time was for 8 days in late April 2018, then for 14 days in late January 2019, then for the first 7 days of May 2022, then for the second week of October 2022, and most recently for 14 days in January 2023.
2. Distortion in the Hydro One Voltage
In the five experiments, results were very approximately the same each time with average THD of between 3 and 4 percent. A notable difference was that during the third experiment (May 2022), the THD changed significantly during the measurement period, decreasing by about 1 percent in one step, cause unknown. The two most recent experiments provide the most detailed views of what is happening.
One could argue that the general trend in the measured distortion between these five experiments is for slowly increasing distortion over the years.
| Date | Average THD | Measurements |
| Apr 2018 | 3.08% | 1187 |
| Jan 2019 | 3.40% | 1935 |
| May 2022 | 4.54%, 3.65% | 2080 |
| Oct 2022 | 3.73% | 1983 |
| Jan 2023 | 4.15% | 4032 |
3. THD During April 2018
During the last week of April 2018, I measured the total harmonic distortion (THD) of the power line voltage waveform delivered to my home by Hydro One in Ontario. Measurements began the afternoon of 22 April and continued until the morning of 1 May, although I used only the measurements taken during April, for a total of 8 days. Measurements were made with an AEMC Instruments Power Quality Logger, model PQL-120. A total of 1187 measurements were made, one every 10 minutes.

Based on the 1187 separate measurements, the average total harmonic distortion during the 8-day period was 3.08%. As you can see from the charts, values ranged from 2.6% to 3.7%, but were most often in the range of 2.9–3.3%.

Interestingly, the variation or spread in the amount of distortion was generally less during the nighttime hours (2300-0600 hours) and greatest during the day and evening hours (0600-2300), as shown below.

4. THD During January 2019
As illustrated in the chart below, the average distortion during the 14 day measurement period in January 2019 was 3.40 percent, based on 1,939 measurements.

5. THD During First Week of May 2022
Remarkably, around 8 p.m. on the 4th of May 2022, the total harmonic distortion (THD) of the voltage waveform changed from an average of 4.54% (924 measurements) to an average of 3.65% (1,156 measurements). The cause of this change is unknown to me and is certainly not due to any dramatic change in the electrical load presented by the appliances in my own home.

6. THD During Second Week of October 2022
This experiment provides more detailed observations of THD in the voltage at my house in eastern Ontario. Measurements were made automatically every 5 minutes beginning in early afternoon of 08 October 2022 and continued until late morning of 15 October. Measurements included the average THD during each 5-minute recording period, the minimum THD during each of those periods, and the maximum THD during those same periods. The overall average THD during this experiment was 3.73%, and the average THD ranged from 3.3 to 4.4 percent. There were 1,983 sets of measurements made.

The chart above shows the THD during the second week of October 2022. The black line is the average THD during any 5-minute recording period. The red line is the instantaneous maximum THD during those periods, and the amber line is the instantaneous minimum during those periods.
You can see that the instantaneous total harmonic distortion sometimes exceeds 8%.

The chart above shows the average total harmonic distortion as a function of the local time of day during all of the days of the experiment. You can see that there is a modest increase in THD during the evening hours, roughly 7:00 to 11:00 p.m. each day. This is different from observations during April 2018.
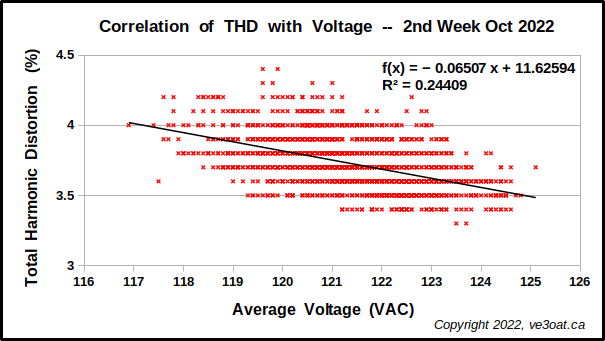
The chart above shows the correlation of THD with supplied average voltage during any measurement period. You can see that there is a mild negative correlation (r² = 0.244) between the THD and the voltage, that is, that the THD tends to decrease as the voltage increases. The straight line through the mass of data points is a linear least-squares-fit, with its corresponding equation and calculated coefficient of correlation at the upper-right in the graph area.
7. THD During Two Weeks in January 2023
Following the same procedure as last October, 4,032 sets of measurements were made over this 14 day period. The overall average THD during this time was 4.15%, with average values ranging from 3.5% to 4.9%, higher than in the October 2022 experiment.

The chart above shows the total harmonic distortion of Hydro One's voltage waveform, with the same colour scheme as in the October 2022 experiment. Note that the instantaneous distortion sometimes exceeds 8%, and was once time almost 11%. It may be significant that the distortion seemed to be better controlled, or was just better behaved, during the second week of the experiment, that is after 15 January.
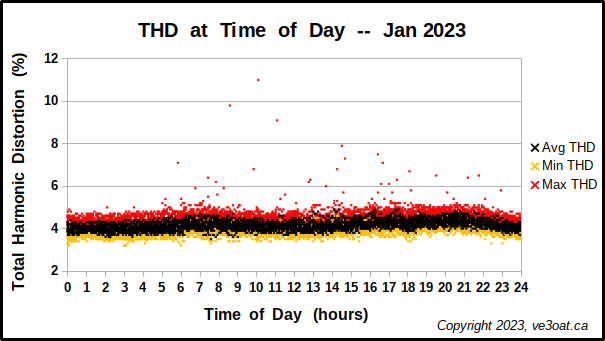
The chart above shows the waveform distortion as a function of the time of day when each measurement was made. One can see that the distortion is usually higher and "less well-behaved" during the period 6:00 a.m. until 10 p.m. This is probably the period of greatest load on the electrical supply system.

The chart above again shows the mild, negative correlation of voltage waveform harmonic distortion with the amplitude of the supplied mains voltage. It is logical that the observed waveform distortion is higher when the electrical supply system is under stress and unable to supply a higher voltage.
8. Hydro One's Specified Limits of THD
For delivered voltages of less than 400 volts, like your house voltage, Hydro One used to publicly specify (but I can no longer find it) a THD limit of 11% for short-term and 8% for long-term variations. The distortion at the times of my own measurements has been well within Hydro One's stated limits.