

Graphical Monthly Summaries of My Voltage Measurements
Long page!
What follows are separate charts for each month of 2019 showing the thousands of voltage measurements I have made at my wall outlet of the too much voltage delivered to my home and appliances by Hydro One, Ontario. The months are in reverse chronological order.
If you have questions or comments about any of the information here, please contact me.
December 2019
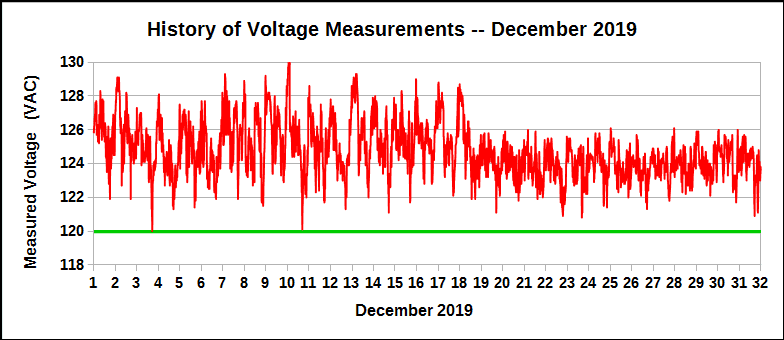
Like some other months, December was a mix of two kinds of voltage behaviour. Until 18 December, the average voltage was 125.13 VAC, with rather wide variations in the voltage during each day. After the 18th, the average was 123.9 VAC, with much less variation during each day, as can be seem in the chart abpve. Overall, the voltage has been greater than the nominal 120 VAC about 99.98% of the time, based on 4,460 measurements.
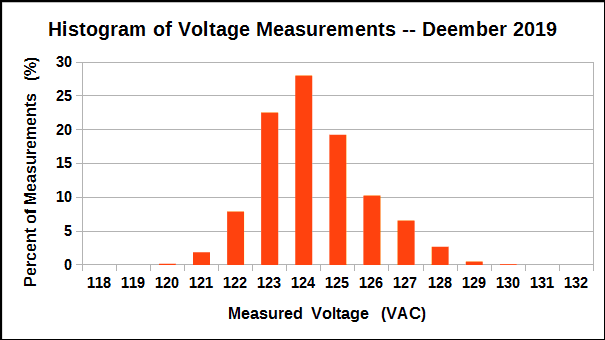
The histogram above shows the statistical distribution of voltage measurements for the whole month, so is a mix of the two voltage behaviours, before and after 18 December. You can see the absolute absence of any measurements less than 120.0 VAC during the month. Ideally, the voltage should be above 120 VAC only 50% of the time, and below 120 VAC the other 50% of the time. Clearly, this is not what is happening with the voltage delivered to my home by Ontario's Hydro One.
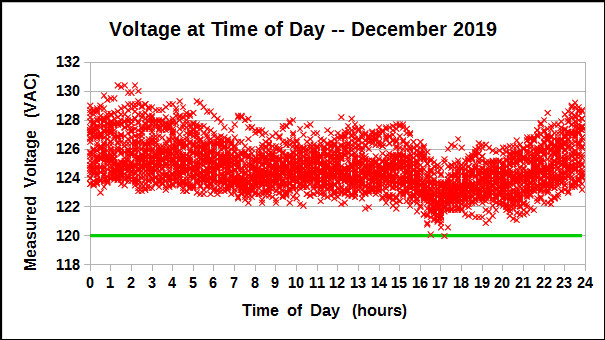
The diagram above shows all of the voltage measurements according to the time of day when they were taken during December. This, too, is a mix of the two voltage behaviours, before and after 18 December.
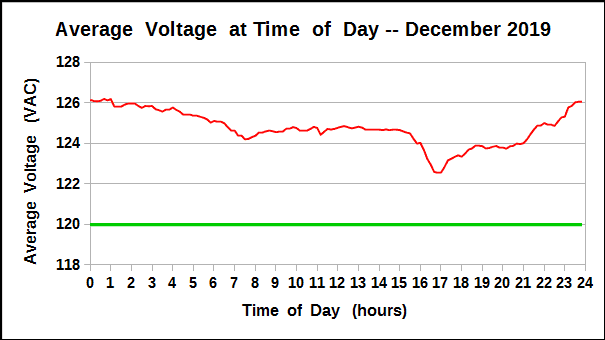
The diagram below shows the average voltage at time of day for the whole month.
November 2019
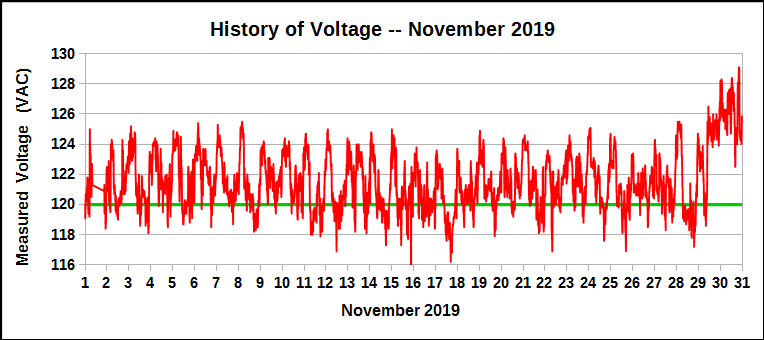
November was a rather mundane continuation of October until 10:00 a.m. on 29 November when the voltage suddenly increased by about 4 VAC. Up to that time the average for the month had been just under 121.5 volts, but afterward the average was 125.77 VAC and at one point reached 129.1 volts. Overall, the voltage has been greater than the nominal 120 VAC about 77.6% of the time, based on 4,245 measurements.
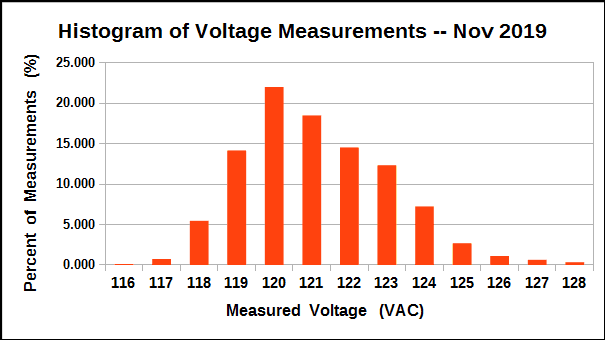
The histogram above shows the statistical distribution of voltage measurements and the "long tail" of voltages above the supposed nominal value of 120 VAC.
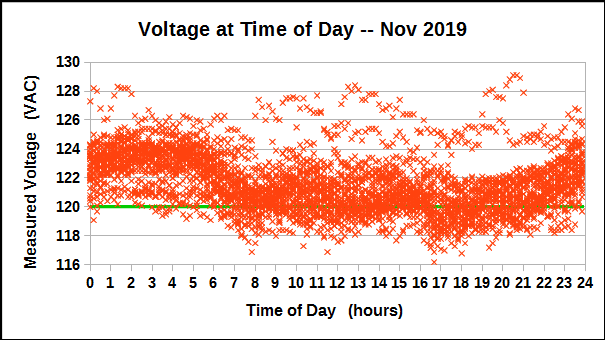
The diagram above shows all of the voltage measurements according to the time of day when they were taken during November. The higher voltage measurements after 10:00 a.m. on 29 November can be seen scattered above the main body of other measurements before that time.
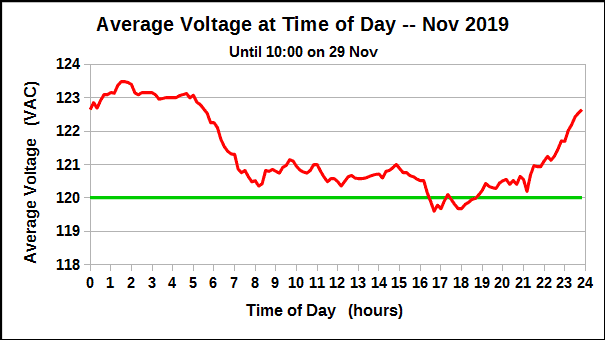
The diagram below shows the average voltage at time of day during the month but before the dramatic change of voltage at 10:00 a.m. 29 November.
October 2019
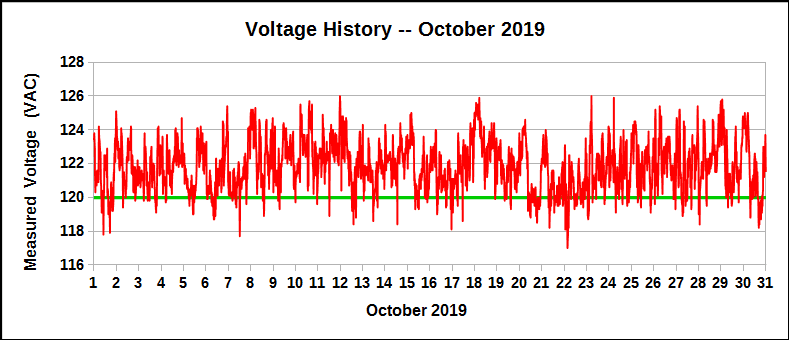
October was a continuation of the latter half of September with an average voltage of 121.85 VAC provided by Hydro One to my home during October, based on 4,460 separate measurements at 10-minute intervals. Voltage swings were higher than has been normal, amounting to ±2 volts or more. The voltage was greater than the nominal 120 VAC about 88.7$ of the time, much higher than the "normal" 50%.
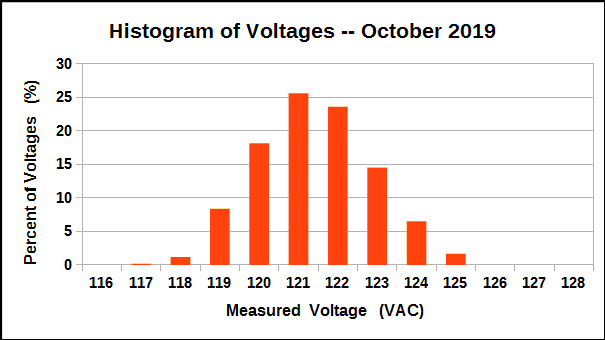
The histogram above shows the statistical distribution of voltage measurements and the predominance of voltages above the supposed nominal value of 120 VAC.
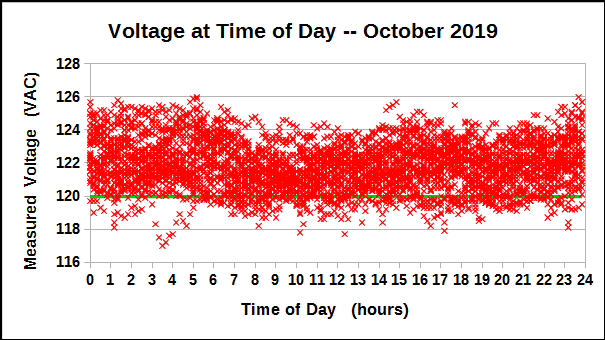
The diagram above shows all of the voltage measurements according to the time of day when they were taken during October. It seems almost not worth doing this plot of data, because the voltage is so variable that any diurnal pattern of lows and highs during certain periods of the day seems lost amid all the variability of the voltage.
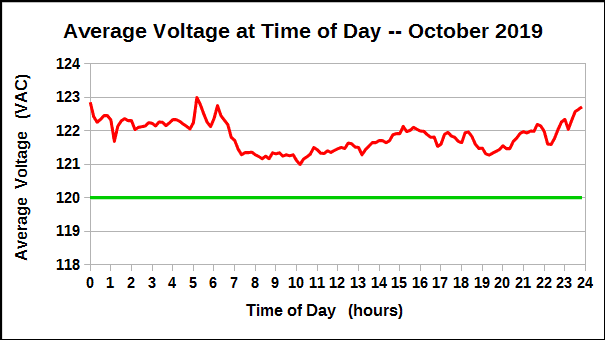
Having said that, there is a visible diurnal variation in the average voltage at any time of day during October. It is not as dramatic as some previous months but it can be seen in the average despite the "noise" of the individual measurements.
September 2019
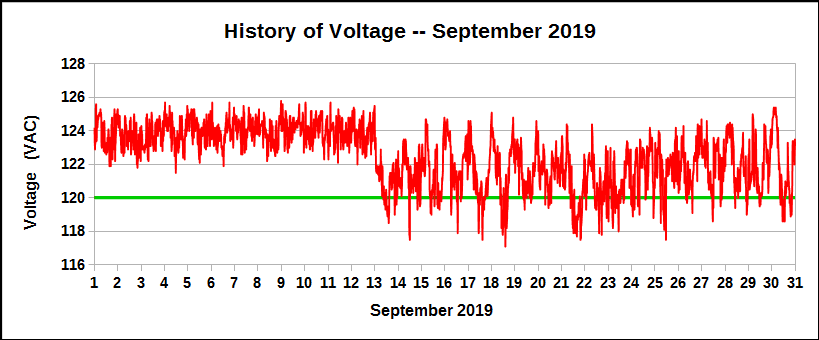
September was another in a series of "interesting" months. The month started with a nicely controlled voltage, varying about &plusmin; 1 volt but with a moderately high voltage, averaging almost 124 VAC (123.94 actually). Early on 13 September, the voltage was reduced significantly and thereafter averaged about 121.55 VAC. At the same time, however, the voltage began varying by much more, as much as &plusmin; 3 volts each day. Even with all the voltage swings, the voltage was not often less than the nominal voltage of 120 VAC, and was greater than that about 90.3% of the time during the month. It should of course be greater than 120 only about 50% of the time.
The behaviour of the voltage in September is reminiscent of May 2019.
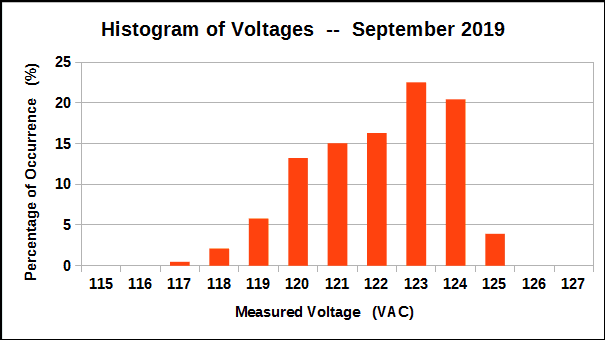
The histogram above shows the statistical distribution of voltage measurements and the predominance of voltages above the supposed nominal value of 120 VAC (too much voltage).
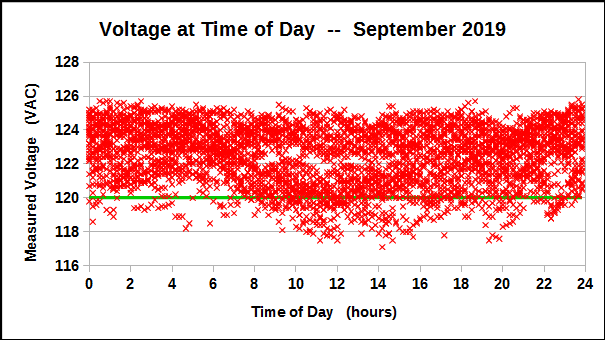
The diagram above shows all of the voltage measurements according to the time of day when they were taken during September. It seems almost not worth doing this plot of data, because the voltage is so variable that any diurnal pattern of lows and highs during certain periods of the day is lost amid all the variability of the voltage.
August 2019
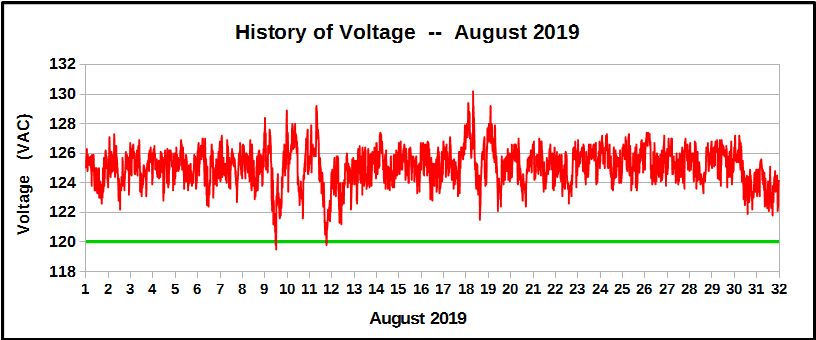
Well, similar to July, the month of August was kind of craxy. The average voltage over the month was 125.12 VAC and there were 5 days when the voltage seemed almost out of control : 9, 10, 11, 18, and 19 August. At one time, the voltage reached 130.2 VAC. The only hopeful sign during the month was that for the last two days (30 and 31), the voltage seemed to have dropped by two volts.
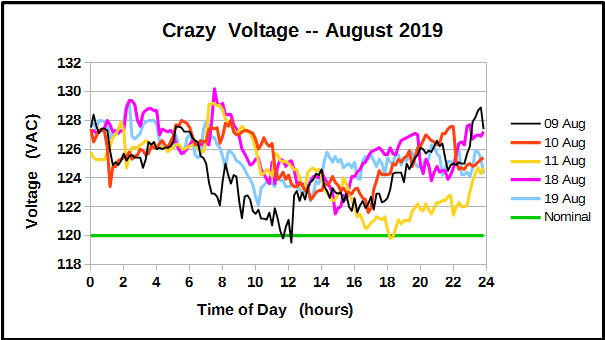
Above is a graph of the voltages on the five days with crazy voltage behaviour. The only pattern that I see here is that the voltage was highest during the early morning hours, similar to most days in other months, except that these voltages were especially, even dangerously, high. One wonders what is going on at Hydro One and their generating stations during these periods. Can someone explain, please??
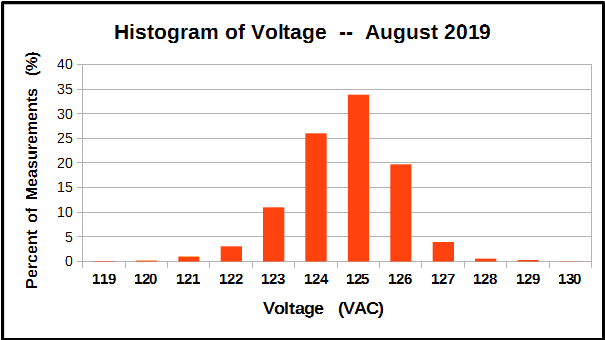
The histogram above shows the statistical distribution of voltage measurements and the predominance of voltages above the supposed nominal value of 120 VAC (too much voltage). The voltage should be above and below the nominal voltage 50% of the time each. Clearly it is not.
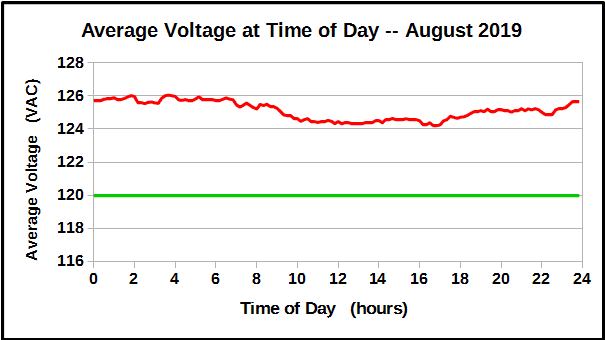
Looking at the Average Voltage at Time of Day diagram above shows the general trend of voltage being moderately higher at night and lower during the daylight hours of each day.
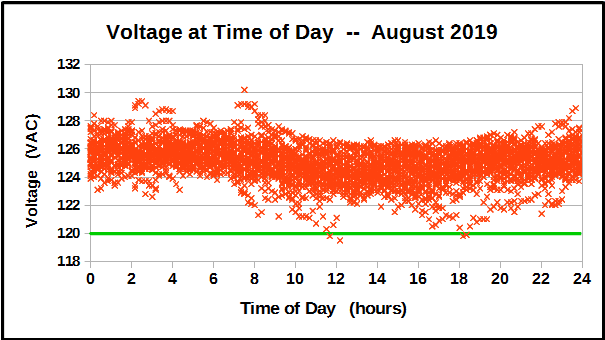
The diagram above shows all of the voltage measurements according to the time of day when they were taken during August.
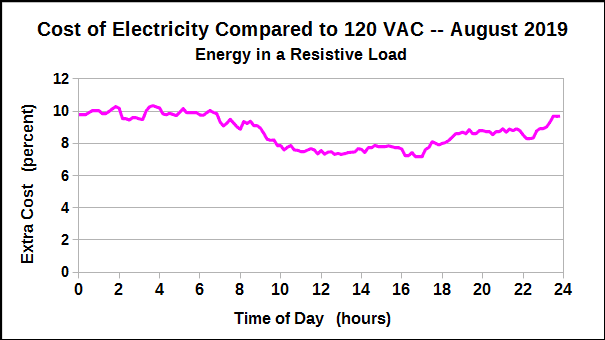
And What Does This Extra Voltage Cost?
We know that the power dissipated, and energy consumed, by a resistive load (like your toaster, hair-dryer, clothes-dryer, etc.) is proportional to the square of the voltage. So we can compare these house voltages with the power dissipated when only 120 VAC is applied and find the extra power that is dissipated and that we have to pay for. The graph below shows this extra cost according to the average voltage at any time of day during August. It amounts to between 7 and 10% above what we would have been charged if the voltage had been only 120 VAC, which is of course the voltage that we should have received from Hydro One.
July 2019
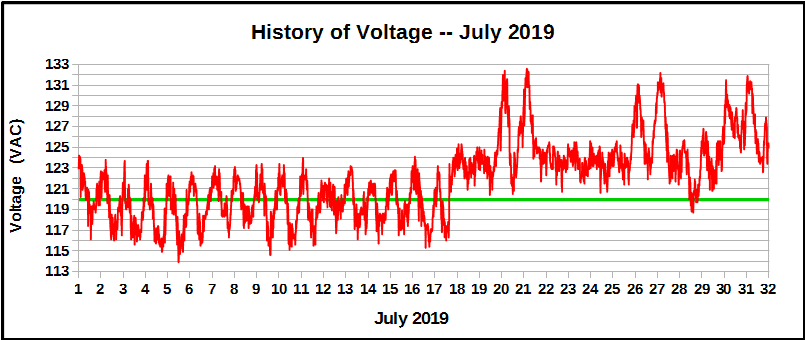
The month of July was just crazy. There were three very different "voltage behaviours" during the month. First, and until 17 July, the voltage was well-behaved with an average very near the nominal voltage of 120 VAC. This was good. Then, around 3:30 p.m. on 17 July the voltage was suddenly increased by about 5 VAC, from 117 to 122 VAC, and with the voltage never going below 120 VAC. Then, superimposed on this new, higher voltage, there were six days when the voltage appeared to be out of control, rising at times above 130 VAC and as high as 132.6 VAC. Overall, the average voltage for the month was 121.96 VAC, and was greater than the nominal 120 VAC 67.2% of the time, based on 4,460 measurements.
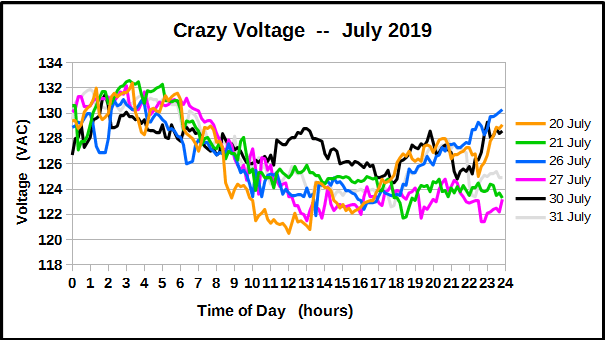
Above is a graph of the voltages on the six days with crazy voltage behaviour. The only pattern that I see here is that the voltage was highest during the early morning hours, similar to most days, except that these voltages were especially, even dangerously, high. One wonders what is going on at Hydro One and their generating stations. Can someone explain, please??
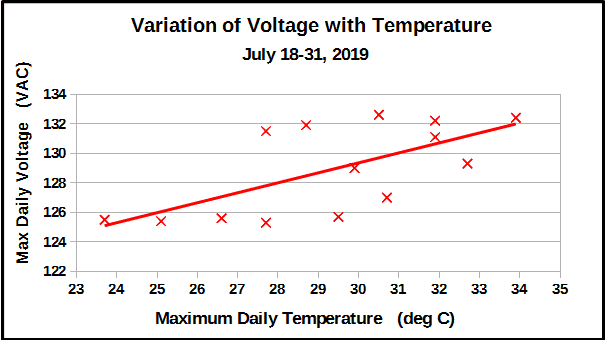
So, are the high temperatures causing these wild voltage variations? It seems so. Although the data sample is small (only 14 days), the chart above does show that when the daily maximum temperature is 27° C or less, the voltage is well-behaved. When the maximum temperature is above 27° C, there is a good chance (6 times out of 11) that the voltage will misbehave and go to 130 VAC or above. My guess is that there is some errant computer algorithm that makes inconsistently bad decisions when the outside temperature is 27° C or above. Or, maybe it is just some nervous supervisor at Hydro One? It is curious that the "bad" days seem to have come in pairs.
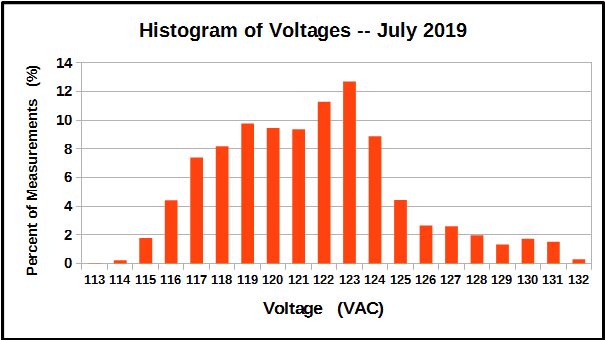
The histogram above shows the statistical distribution of voltage measurements and the predominance of voltages above the supposed nominal value of 120 VAC (too much voltage). The voltage should be above and below the nominal voltage 50% of the time each. Clearly it is not.
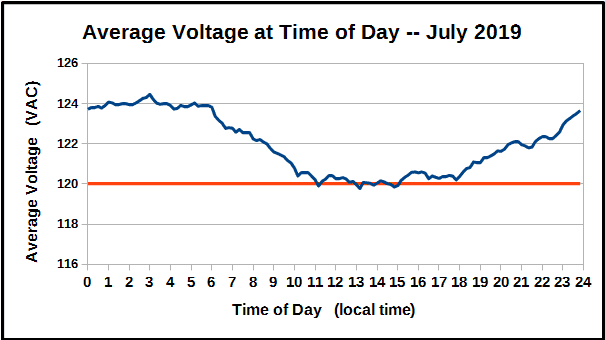
Looking at the Average Voltage at Time of Day diagram above shows the general trend of voltage being higher at night and lower during the daylight hours of each day. But this chart is almost meaningless because it is comprised of data from before 17 July when the voltage was well-behaved, data afterwards when the voltage was generally higher by 5 volts, and data from the six days when the voltage was out of control.
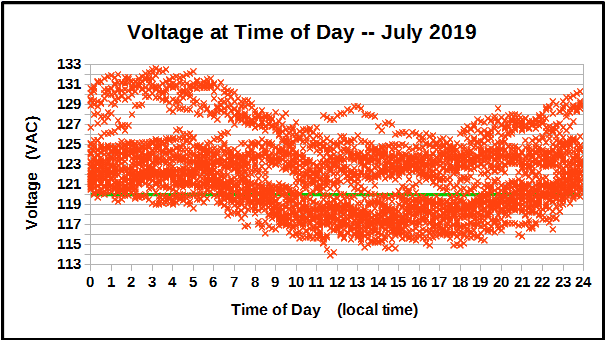
The diagram above shows all of the voltage measurements according to the time of day when they were taken during July. You can easily see how confused the data is, as described above.
June 2019
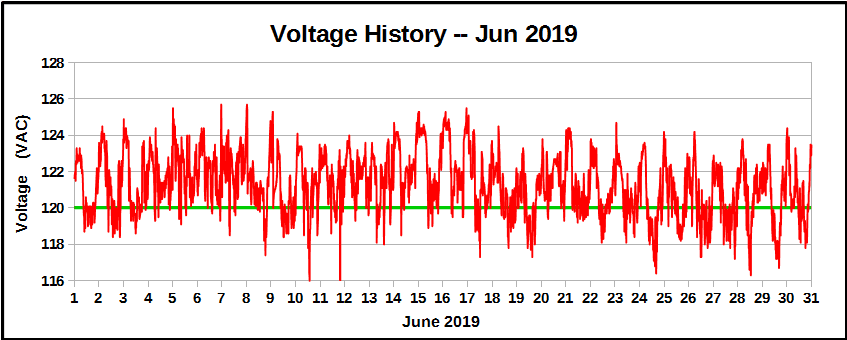
The month of June was a continuation of the trend begun during May, and the delivered voltage has continued to decrease slowly. The average voltage for the month was 121.31 VAC, although still with more hour-to-hour variability than expected. The voltage was greater than the nominal 120 VAC about 76.8% of the time, based on 4,317 measurements. The chart above shows the how the voltage varied during the month.
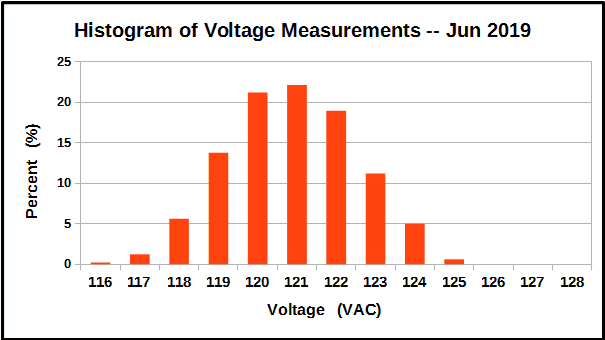
The histogram above shows the statistical distribution of voltage measurements and the predominance of voltages above the supposed nominal value of 120 VAC. The voltage should be above and below the nominal voltage 50% of the time each. Clearly it is still not, although this situation is improving.
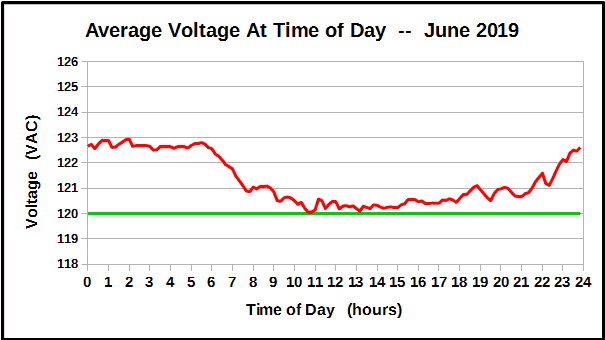
Looking at the Average Voltage at Time of Day diagram above shows the general trend of voltage being higher at night and lower during the daylight hours of each day. Comparing this chart with those for several previous months, one can see how the average voltage is approaching the nominal voltage of 120 VAC.
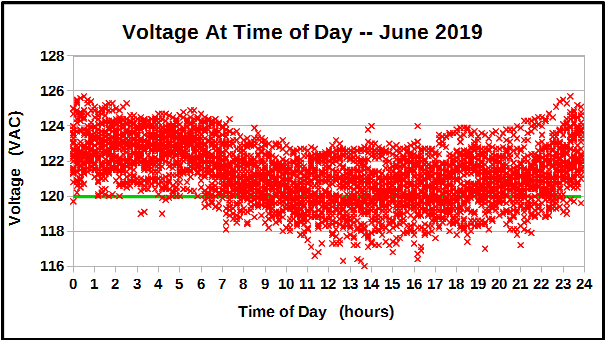
The diagram above shows all of the voltage measurements according to the time of day when they were taken during June. The general tendency for the voltage to be higher at night than during the day is still visible in this chart.
May 2019
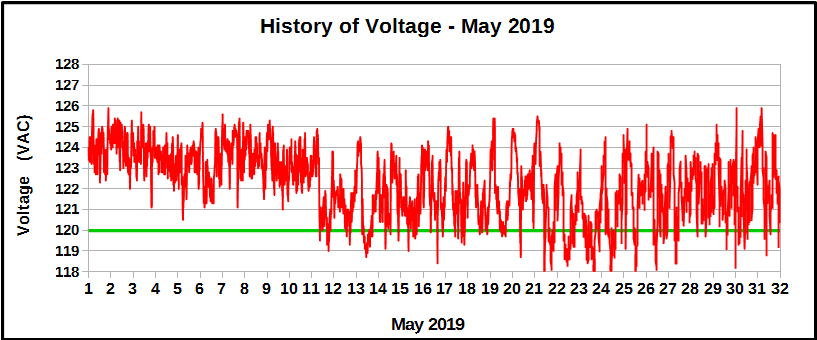
The month of May began as a continuation of the last week of April, but around 8:00 a.m. on Saturday, 11 May, Hydro One lowered the average voltage by about 2 VAC and the measurements continued thereafter with much greater variability than before. Before this change the voltage had been greater than the nominal 120 VAC 100% of the time, but afterwards the voltage was so variable that it was greater than the nominal 120 VAC only about 85% of the time. The chart above easily illustrates this change in behaviour. Overall, the average voltage for the month was 122.28 VAC, based on 4,461 measurements.
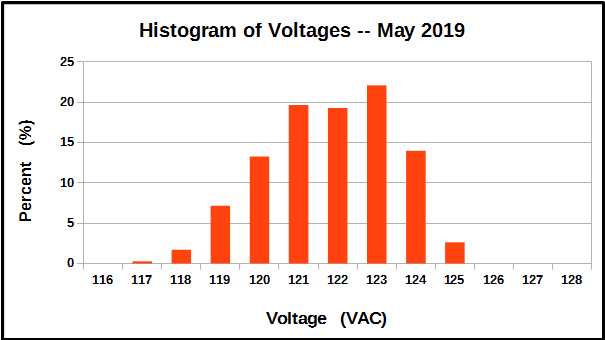
The histogram above shows the statistical distribution of voltage measurements and the predominance of voltages above the supposed nominal value of 120 VAC. The voltage should be above and below the nominal voltage 50% of the time each. Clearly it is not.
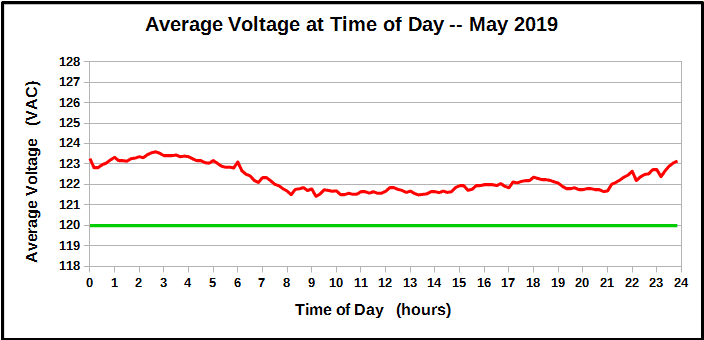
Looking at the Average Voltage at Time of Day diagram above shows the general trend of voltage being higher at night and lower during the daylight hours of each day.
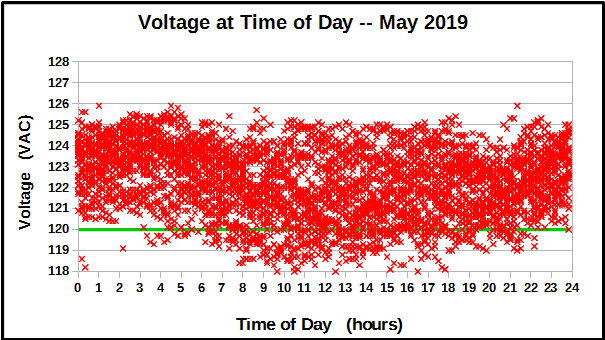
The diagram above shows all of the voltage measurements according to the time of day when they were taken during May. The wide variability of the voltage delivered to my home since the change on 11 May now obscures the general trend for higher voltages during the night.
April 2019
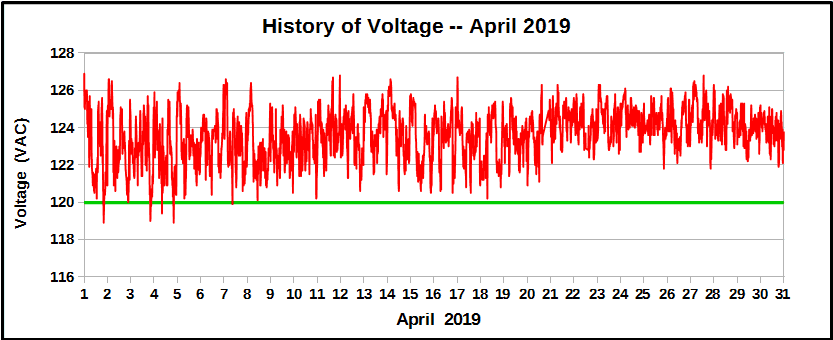
The beginning of April 2019 saw a continuation of the last several months. However, following two power outages of several hours on 20 April, the restored voltage was remarkable for two reasons : the voltage was now better regulated (that is, less variable during each day), and now averaged about one volt higher than before the outage, and 4 VAC above the nominal voltage of 120 VAC. The average voltage during April overall was 123.64 VAC, based on 4,275 measurements taken once each 10 minutes. The voltage was greater than the nominal 120 VAC a whopping 99.5% of the time, as you can see from the charts above and below. The change in behavior after the power outage on 20 April is also evident in the chart above.
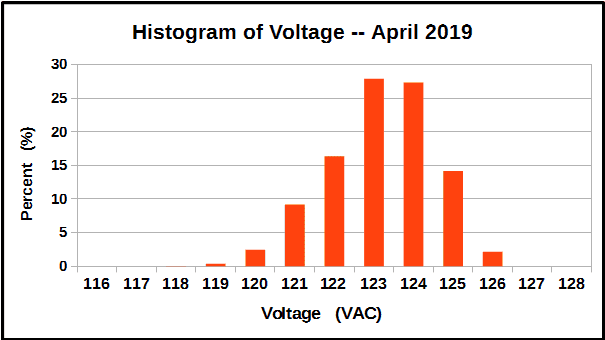
The histogram above shows the statistical distribution of voltage measurements and the predominance of voltages above the supposed nominal value of 120 VAC. The voltage should be above and below the nominal voltage 50% of the time each. Clearly it is not.
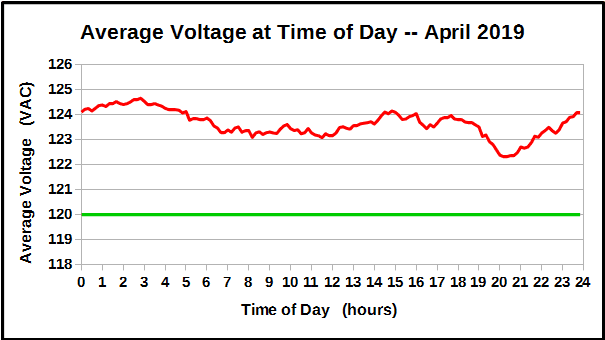
Looking at the Average Voltage at Time of Day diagram above shows the general trend of voltage being higher at night and lower during the latter part of each day.
The diagram above shows all of the voltage measurements according to the time of day when they were taken. The voltage was "well-behaved" in the sense that there were few times when the voltage strayed from this rather well-defined band of observed voltages. Our conclusions about the variation of voltage gained from the histogram are also confirmed.
March 2019
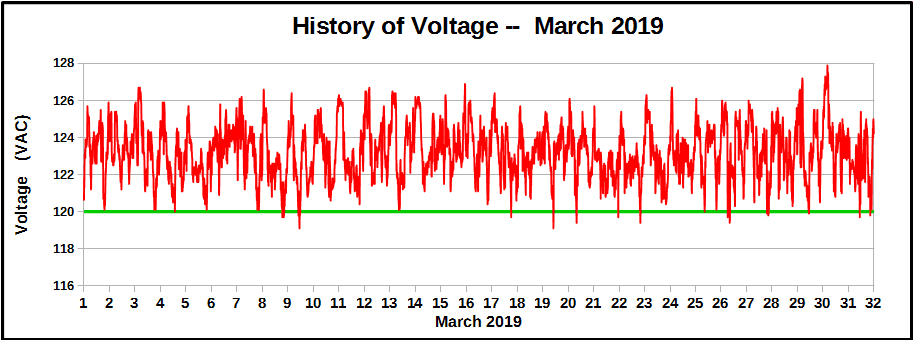
March 2019 saw a continuation of the last several months with no significant changes — the "usual" situation of delivered voltages significantly greater than the nominal voltage of 120 VAC. The average voltage during March was 123.24 VAC, based on 4,455 measurements taken once each 10 minutes. The voltage was greater than the nominal 120 VAC a whopping 99.28% of the time, as you can see from the charts above and below. Remarkably, early one day, the voltage went as high as 127.9 VAC.
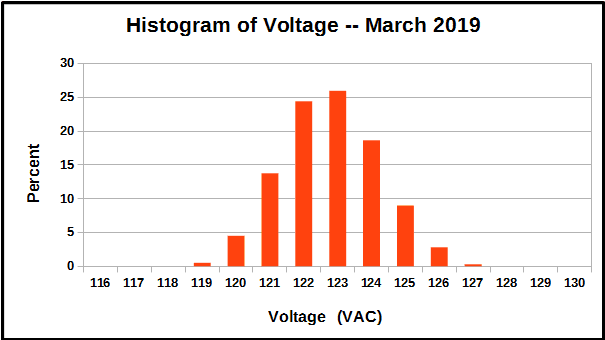
The histogram above shows the statistical distribution of voltage measurements and the predominance of voltages above the supposed nominal value of 120 VAC. The voltage should be above and below the nominal voltage 50% of the time each. Clearly it is not.
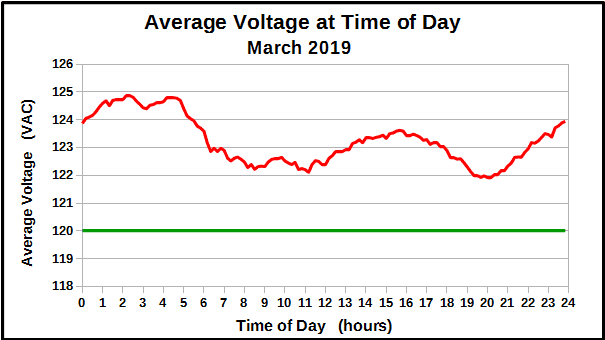
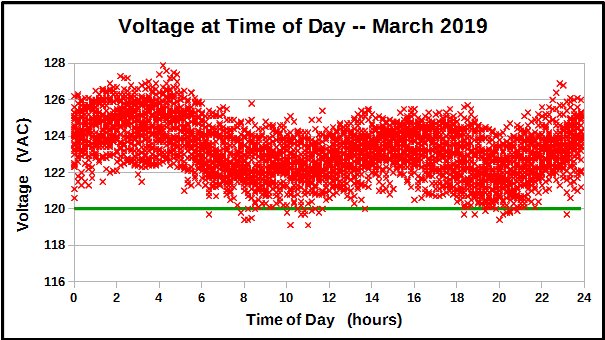
Looking at the Average Voltage at Time of Day diagram above shows the general trend of voltage being higher at night and lower during the latter part of each day.
The diagram above shows all of the voltage measurements according to the time of day when they were taken. The voltage was "well-behaved" in the sense that there were few times that the voltage strayed from this rather well-defined band of observed voltages. Our conclusions about the variation of voltage gained from the histogram are also confirmed.
February 2019
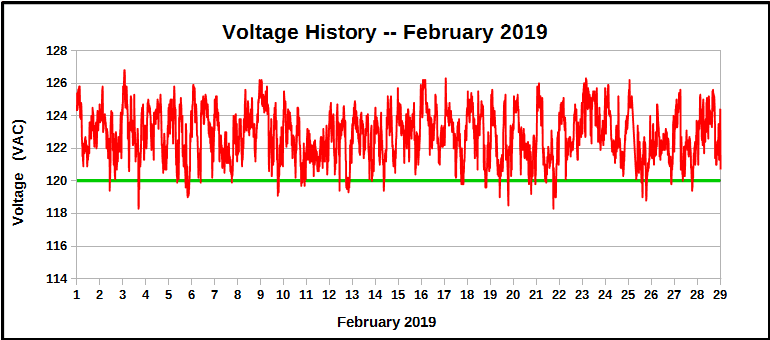
February was a continuation of January 2019 with no significant changes the "usual" situation of delivered voltages significantly greater than the nominal voltage of 120 VAC. The average voltage during February 2019 was 122.83 VAC, based on 4,004 measurements taken once each 10 minutes. The voltage was greater than the nominal 120 VAC a whopping 96.88% of the time, as you can see from the charts above and below.
There was a power outage of approximately 2½ hours early on 25 February, probably due the the very windy weather, after which the voltage continued as before.
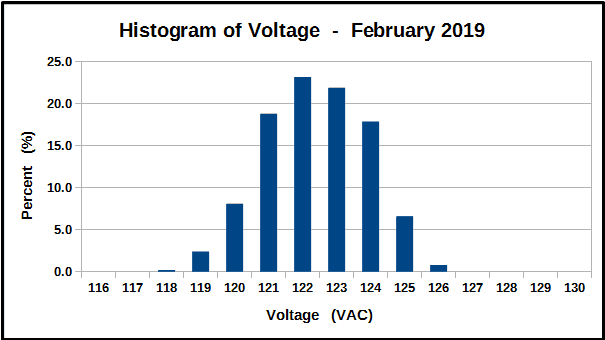
The histogram above shows the statistical distribution of voltage measurements and the predominance of voltages above the supposed nominal value of 120 VAC.
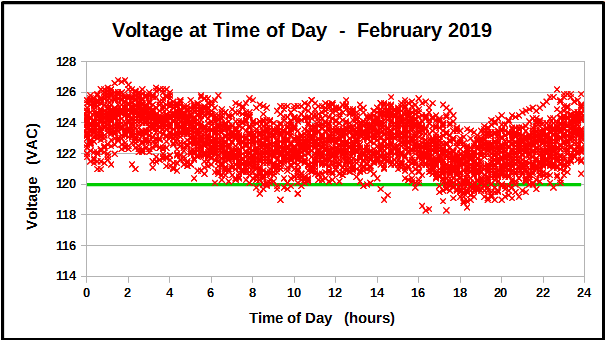
Looking at the Voltage at Time of Day diagram above shows the general trend of voltage being higher at night and lower during the latter part of each day. The voltage was "well-behaved" in the sense that there were few times that the voltage strayed from the rather well-defined band of voltages that were observed at any time during the day or night.
January 2019
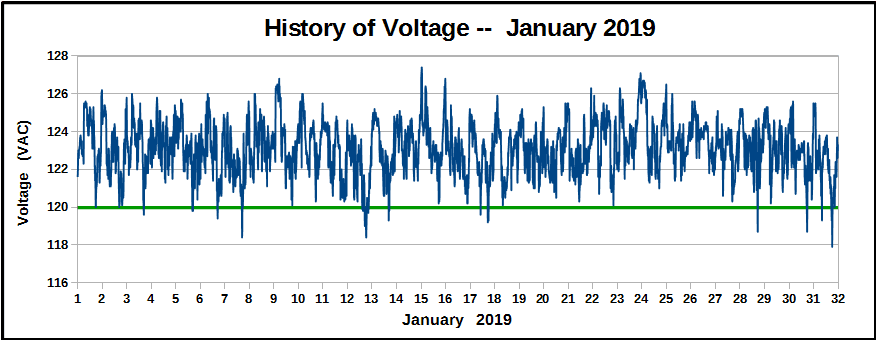
January was a continuation of the last half of December 2018 and a return to the "usual" situation of delivered voltages significantly greater than the nominal voltage of 120 VAC. The average voltage during January 2019 was 123.12 VAC, based on 4,460 measurements taken once each 10 minutes. The voltage was greater than the nominal 120 VAC a whopping 98.66% of the time, as you can see from the charts above and below.
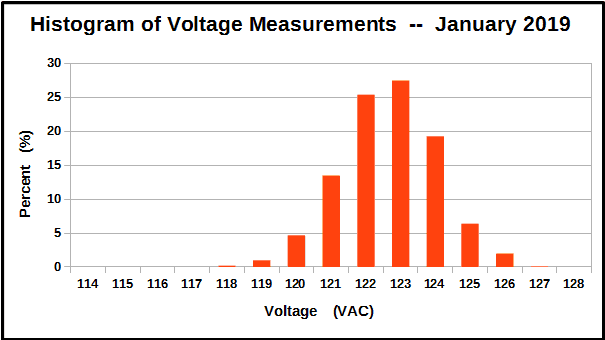
The histogram above shows the statistical distribution of voltage measurements and the predominance of voltages above the supposed nominal value of 120 VAC.
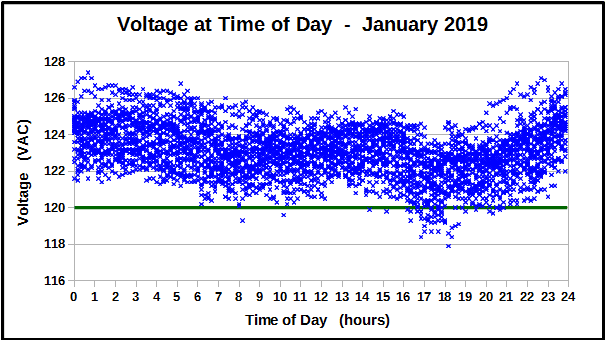
Looking at the Voltage at Time of Day diagram above shows the general trend of voltage being higher at night and lower during the latter part of each day.
Got Data?
If you have voltage measurements from your own neighbourhood and would like to share them, please contact me and I would be glad to exchange raw data and other results with you.