

Graphical Monthly Summaries of My Voltage Measurements
Long page!
What follows are separate charts for each month of 2018 showing the thousands of voltage measurements I have made at my wall outlet of the too much voltage delivered to my home and appliances by Hydro One, Ontario. The months are in reverse chronological order.
If you have questions or comments about any of the information here, please contact me.
December 2018
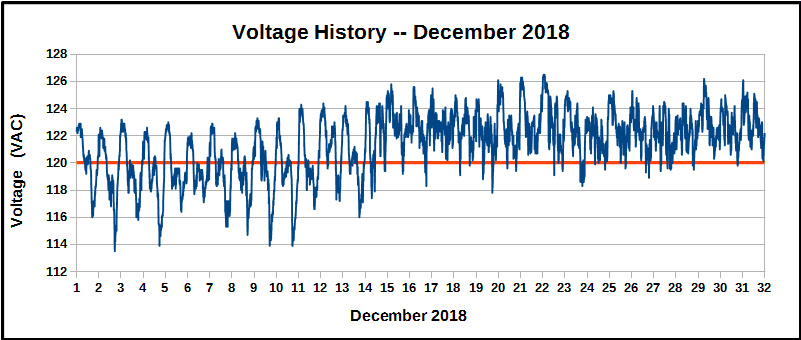
December marked the return of "normal" operating conditions for Hydro One; that is, the end of the unusual electrical conditions caused by damage from the tornado activity in the Ottawa area on 21 September 2018, and a return on 15 December to an average voltage significantly greater than the nominal voltage of 120 VAC.
The average voltage during December 2018 was 121.38 VAC, based on 4,462 measurements taken once each 10 minutes. However, the voltage during the first half of the month was a very comfortable 119.92 VAC, although with large daily swings in voltage, while the voltage during the last half of the month was a not-so-comfortable 122.58 VAC with smaller swings. Overall, the voltage during the month was higher than the nominal 120.0 VAC about 73.6 percent of the time; a figure that is sure to increase if January continues like the last half of December.
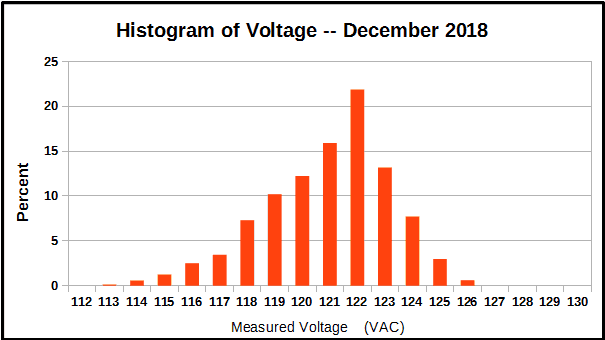
The statistical distribution of voltage measurements shown above is the result of two different "populations" of voltage : one during the first half of the month and one during the last half. The wide daily swings in voltage during the first half of the month cause the long tail on the low-voltage side of the distribution.
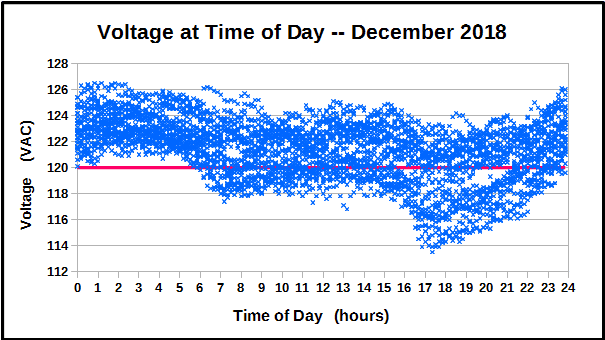
Looking at the Voltage at Time of Day diagram above shows, not so clearly, the two distributions mentioned. The wide daily swings from the early half of the month are shown in the lower part of the mass of measurements while the more constant, higher voltage distribution from the last half of the month is shown near the top of the diagram.
November 2018
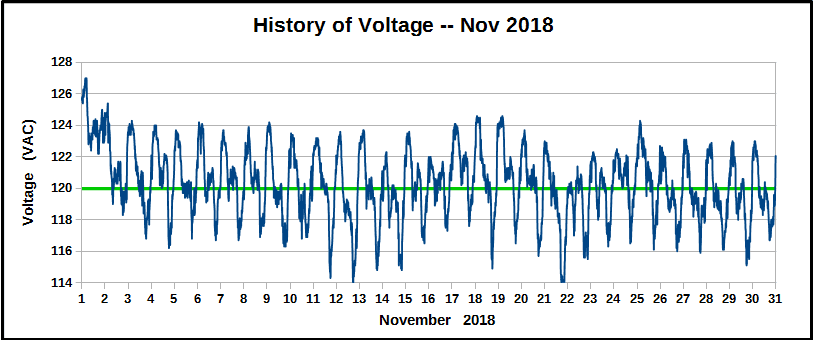
November was notable for a return to average voltages near the nominal voltage of 120VAC. (BRAVO!!)However, large swings in voltage each day of about ±4 volts continued, high in early morning to low in early evening. These swings began after the extreme weather event in the Ottawa area on 21 September.
The average voltage during November 2018 was 120.32 VAC, based on 4,321 measurements taken once each 10 minutes. This is very comfortable. The large swings in voltage, however, are not. Measurements show that the voltage at any time during the month was higher than the nominal 120.0 VAC only about 55.2% of the time, close to the ideal value of 50%.
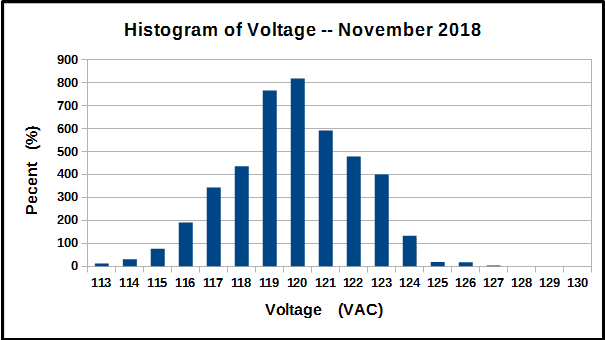
The wide swings in voltage are easily seen in the histogram above by the spreading in the distribution of measurements across the range of possible values. So sometimes the voltage is too low and sometimes too high, making it hard on appliances which depend on a more constant supply of voltage.
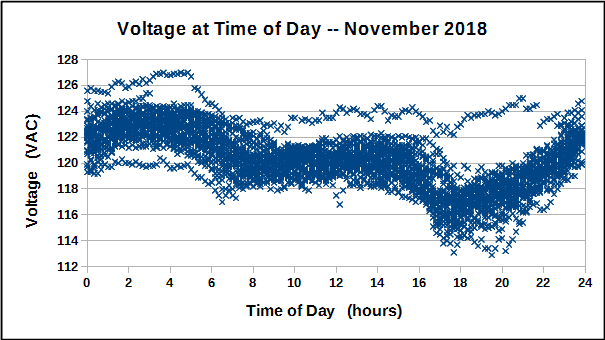
The Voltage at Time of Day diagram clearly shows the regular, daily variation in voltage, high in the early hours of the morning and low in the evenings. The variation is actually rather remarkable for its regularity.
October 2018
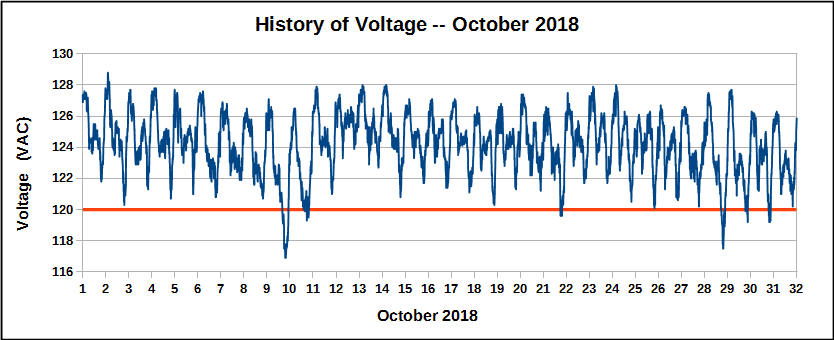
October was notable for the continuation of large swings in voltage each day, high in early morning to low in early evening, that began after the extreme weather event in the Ottawa area on 21 September. Swings of 6 volts and more were common during the month.
The average voltage during October 2018 was 124.23 VAC, based on 4,461 measurements taken once each 10 minutes. This is significantly higher than the average for the previous month (September at 123.0 VAC). Measurements show that the voltage at any time during the month was higher than the nominal 120.0 VAC about 97.80% of the time.
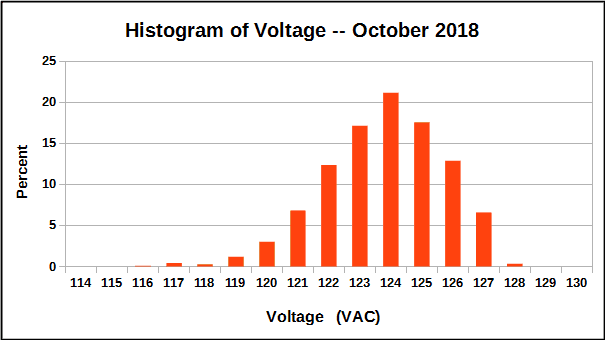
As with most months, the histogram above shows that the average voltage is significantly above the nominal voltage of 120 VAC, and since most of my appliances are designed for 120 VAC I am paying for more voltage (and energy) than my appliances need to operate properly. Notice also that the spread of voltages is greater than in most other months.
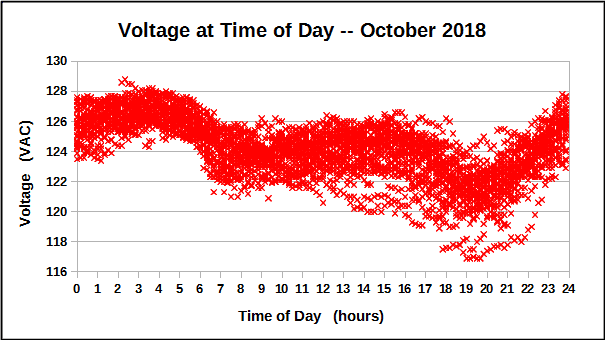
The Voltage at Time of Day diagram is rather peculiar and you have to remember that the behaviour of the voltage was quite different after the September 21/22 power outage than before.
September 2018
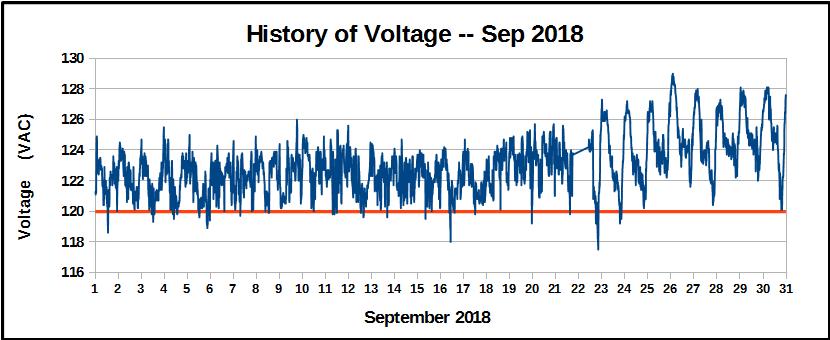
September was notable for the occurrence of multiple tornadoes in eastern Ontario and western Quebec on 21 September, causing major damage and extended power outages in the affected areas. Although my neighbourhood was not damaged, we did suffer an 11-1/2 hour power outage. You can see the outage in the history chart above as a straight line connecting the voltages at the beginning and end of the outage on 21/22 September. You can also see the rise in voltage and the "untamed" variations in voltage every day after the outage. The average voltage after the outage was 124.42 VAC with individual measurements as high as 129.0 VAC. Not nice!
The average voltage for September 2018 was 123.00 VAC, based on 4,219 measurements taken once each 10 minutes. This is significantly higher than the average for the previous month (August at 121.58 VAC). Measurements show that the voltage at any time during the month was higher than the nominal 120.0 VAC about 97.9% of the time.
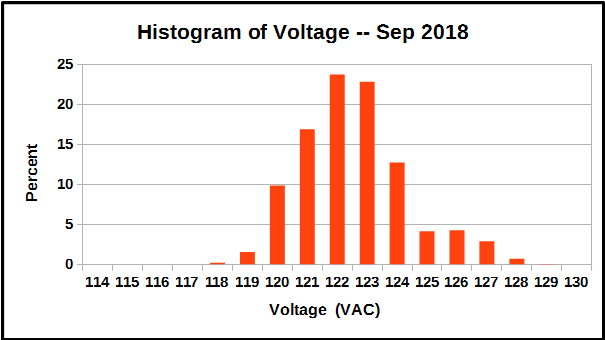
As with most months, the histogram above shows that the average voltage is noticeably above the nominal voltage of 120 VAC, and since most of my appliances are designed for 120 VAC I am paying for more voltage (and energy) than my appliances need to operate properly.
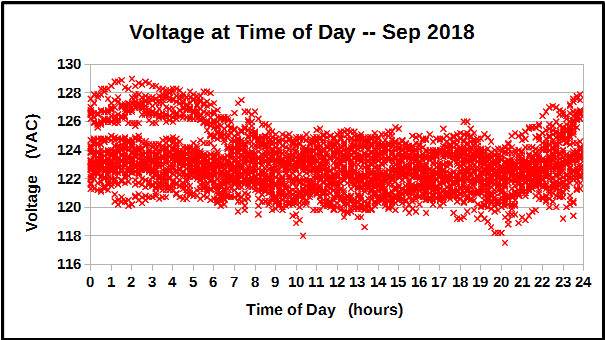
The Voltage at Time of Day diagram is rather peculiar and you have to remember that the behaviour of the voltage was quite different after the September 21/22 power outage than before. Below is a chart showing the voltage at time of day just during the 9 days of September (22-30 Sep) after the outage.
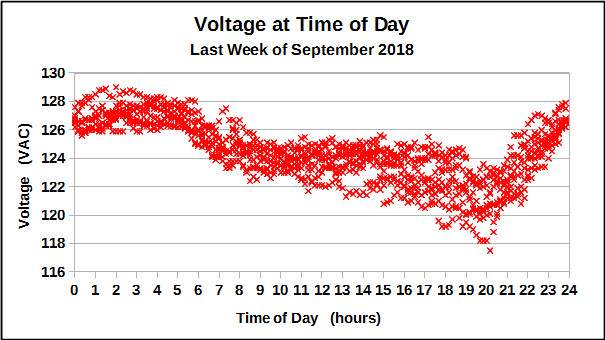
You can easily see the more extreme but regular daily variations in voltage, low during the day and evening but high at night, around 128 VAC, that occurred in the days following the outage. I do not know why the voltage is so "unregulated" in this way.
August 2018
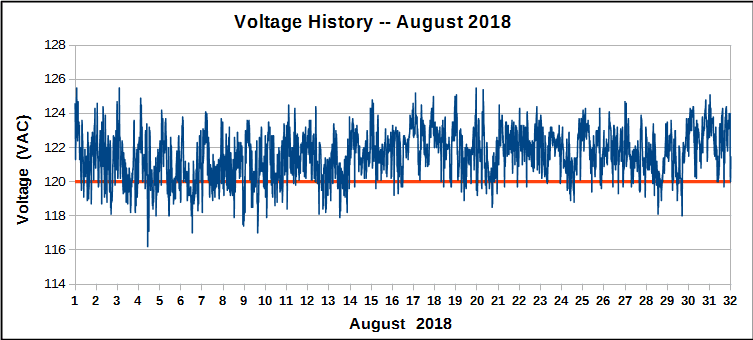
The average voltage for August 2018 was 121.58 VAC, based on 4,459 measurements taken once each 10 minutes. This is slightly higher than the average for the previous month (July at 121.34 VAC). Measurements show that the voltage was higher than the nominal 120.0 VAC about 86.4% of the time.
Given the unusually warm and humid weather experienced in most parts of the province of Ontario and the consequent increase in load on the power generating system for most of July and August, it is obvious that Hydro One and their partners have done a masterful job of regulating the voltage delivered to their customers. As far as I know there have been no brown-outs and certainly no black-outs caused by periods of high load, and no unusual periods of depressed voltage. In fact, at my location, the total range of delivered voltages during July and August have been about the same as most "normal" months, that is, about 115-125 VAC. Some details and comments about the impact of the high temperatures on house voltage are here.
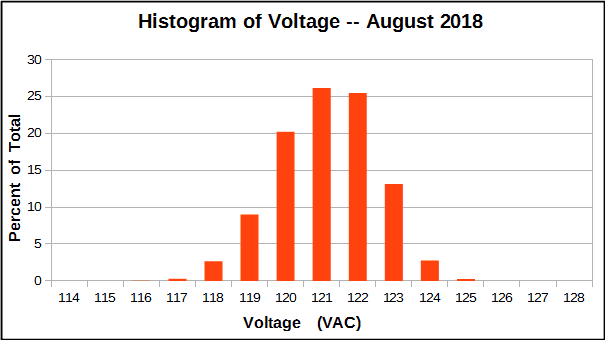
As with most months, the histogram above shows that the average voltage is noticeably above the nominal voltage of 120 VAC, and since most of my appliances are designed for 120 VAC I am paying for more voltage (and energy) than my appliances need to operate properly.
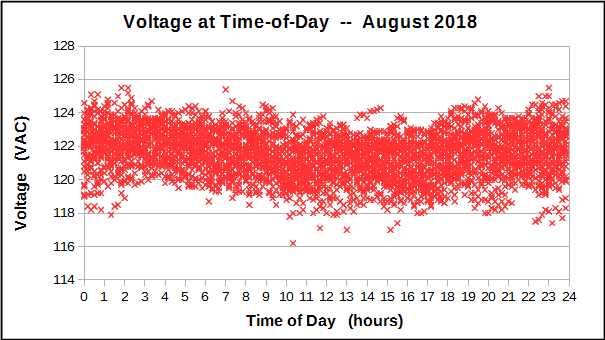
Daily voltage variations in August generally followed the established pattern of being highest during the early morning hours, although the difference seems less noticeable than during the winter months. Perhaps characteristic of a summer pattern, the voltage seems lowest during the late afternoon period.
July 2018
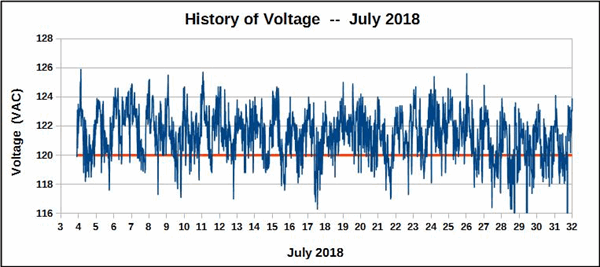
The average voltage for July 2018 was 121.34 VAC, based on 4,396 measurements taken once each 10 minutes. Again, this is modestly less than the average for the previous month (June). Measurements show that the voltage was higher than the nominal 120.0 VAC about 80.0% of the time. Unusually warm and humid weather experienced in most parts of the province of Ontario and the consequent increase in load on the power generating system is almost certainly the reason for the lower voltage.
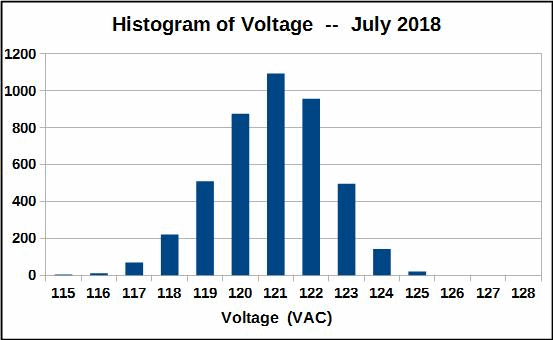
As with most months, the histogram above shows that the average voltage is usually well above the nominal voltage of 120 VAC, and since most of my appliances are designed for 120 VAC I am paying for more voltage (and energy) than my appliances need to operate properly.
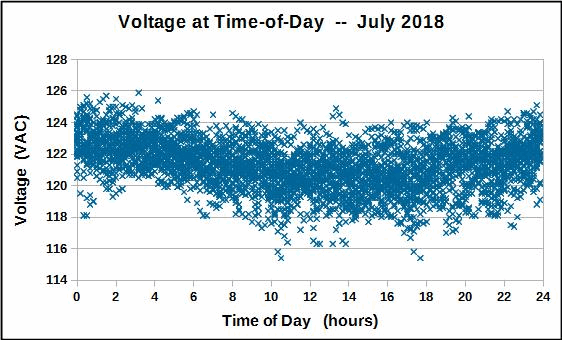
Daily voltage variations in July generally follow the established pattern of being highest during the early morning hours. Perhaps characteristic of a summer pattern, the voltage seems lowest during the late afternoon period.
June 2018
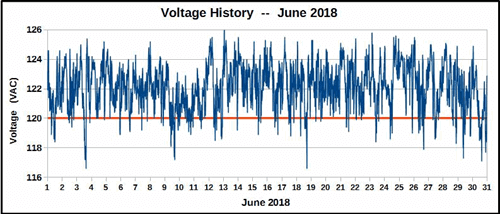
The average voltage for June 2018 was 122.16 VAC, based on 4,316 measurements taken once each 10 minutes. This is modestly less than the average for the previous month (May). Measurements show that the voltage was higher than the nominal 120.0 VAC about 91.5% of the time.
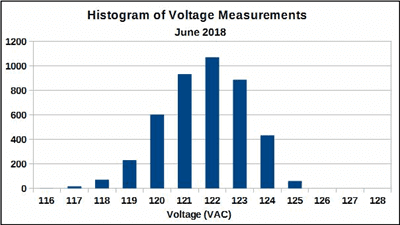
As with most months, the histogram above shows that the average voltage is usually well above the nominal voltage of 120 VAC, and since most of my appliances are designed for 120 VAC I am paying for more voltage (and energy) than my appliances need to operate properly.
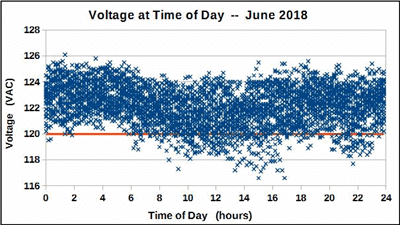
Daily voltage variations in June generally follow the established pattern of being highest during the early morning hours. Perhaps characteristic of a summer pattern, the voltage seems lowest during the late afternoon period.
May 2018
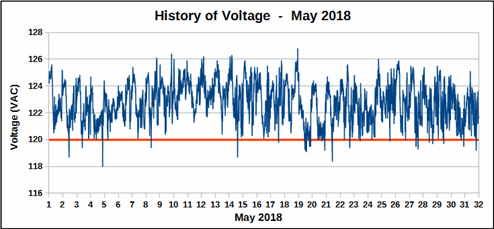
The average voltage for May 2018 was 122.79 VAC, based on 4,459 measurements taken once each 10 minutes. This is the highest monthly average seen since October 2017. Measurements show that the voltage was higher than the nominal 120.0 VAC 98.3% of the time.
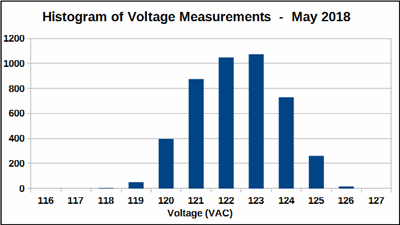
As with most months, the histogram above shows that the average voltage is usually well above the nominal voltage of 120 VAC, and since most of my appliances are designed for 120 VAC I am paying for more voltage (and energy) than my appliances need to operate properly.
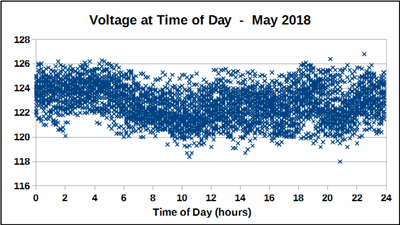
Daily voltage variations in May generally follow the established pattern during the day of being highest during the early morning hours and lowest between 7 and 9 p.m. in the evening (1900-2100 hours).
April 2018
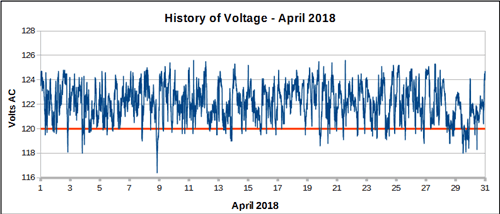
The average voltage for April 2018 was 122.18 VAC, based on 4317 measurements taken once each 10 minutes. This is the highest monthly average seen since October 2017.
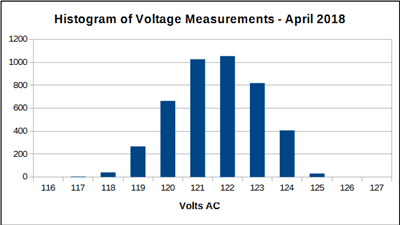
As with most months, the voltage is usually well above the nominal voltage of 120 VAC, and since most of my appliances are designed for 120 VAC I am paying for more voltage (and power) than my appliances need.
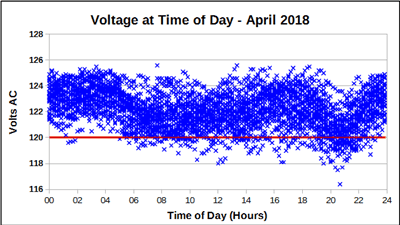
You can see above that the voltage is usually highest during the early morning hours and is lowest between 7 and 9 p.m. in the evening (1900-2100 hours).
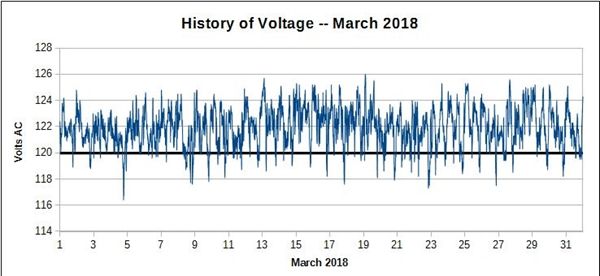
March 2018
The average voltage for the month was 121.96 VAC, about two volts higher than it should be only occasionally dipping below the nominal voltage of 120 VAC.
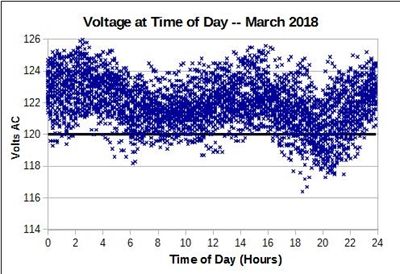
The voltage at Time of Day diagram clearly shows that the voltage is generally highest around 2 am and lowest around 8 pm. The reason for this is, of course, variations in the load by residential consumers' appliances and industrial consumers' machinery.
Overall results for March are largely consistent with recent months.
February 2018
February is the first full month for which we have automated voltage measurements, every 10 minutes.
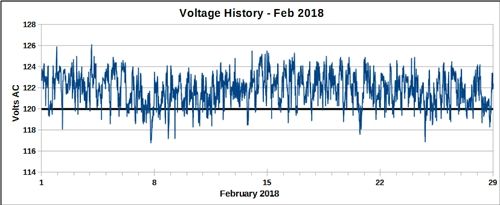
As you can see, we have many more measurements (over 4000) which give a much more accurate picture of what is happening throughout the month than what was possible in previous years with only manual measurements. Average voltage for the month was 121.87 VAC with a spread of 9.3 volts, indicating a (temporary?) reversal of the upward trend in voltage going on for the last year.
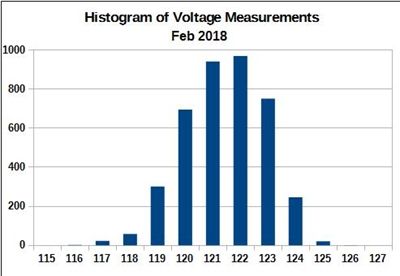
With the greater number of measurements, the histogram of measurements looks much more "normal" (as in Gaussian).
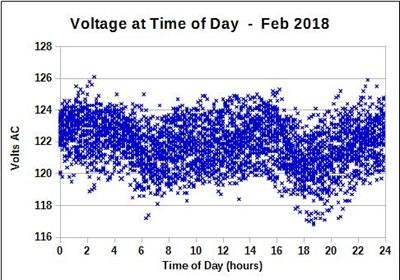
Likewise for our scatter diagram of the voltage as a function of time-of-day, so the trends in voltage during the day become more obvious. The voltage is generally higher during the early morning hours, dips downward around breakfast and "start-up" time and again around suppertime and the early evening.
January 2018
A power outage occurred on the morning of 31 January and any readings of unusually low voltage during that event have been excluded from the measurements and analysis considered here.
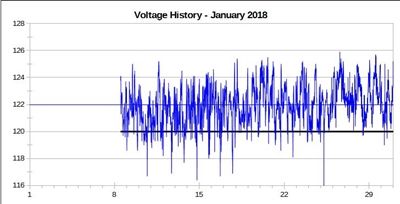
Above is a chart of the voltage measured at my home by an automatic voltage monitoring device during the last three weeks of January. The solid black horizontal line is the nominal voltage of 120 VAC which is supposed to be the average voltage delivered to our homes by Hydro One. You can see that the voltage is almost always greater than the nominal voltage.
Measurements shown for January were made automatically every 10 minutes by a power quality recording device. Voltages measured manually (as done for all previous months) during the first three weeks of January were consistent with the automatic measurements.
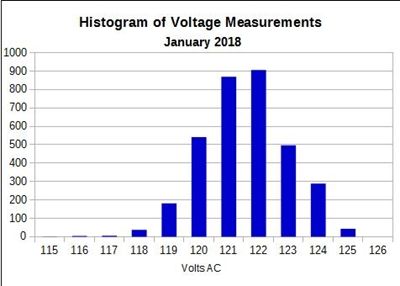
The chart above is a histogram of the voltage measurements during January 2018. You can see from the symmetrical shape of the bars in the histogram that the voltage is statistically well-behaved with an average very near 122.0 VAC.
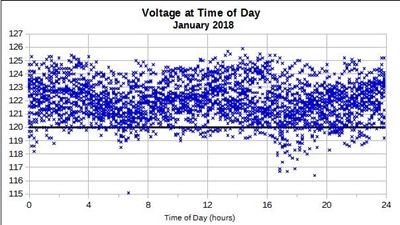
The chart above shows the voltage at the times of day when it was measured during the last three weeks of January. When a large number of measurements are made it is easier to see any persistent trends in the voltage as a function of the time of day. In future months I should have measurements for every day of the month, instead of only the last three weeks.
Got Data?
If you have voltage measurements from your own neighbourhood and would like to share them, please contact me and I would be glad to exchange raw data and other results with you.