
Graphical Monthly Summaries of My Voltage Measurements
Long page!
What follows are separate charts for each month of 2017 showing the thousands of voltage measurements I have made at my wall outlet of too much voltage delivered to my home and appliances by Hydro One. The months are in reverse chronological order.
If you have questions or comments about any of the information here, please contact me.
December 2017
Average voltage for the month of December was 122.17 VAC, about the same as it had been in July 2017. See a summary of monthly voltages.
December 2017 was a bit unusual in that it followed November 2017 (well, no surprise there!) which broke the previously established trend of ever-increasing voltage, due in part to a power outage near the beginning of the month. During December the voltage remained fairly constant but at a slightly lower level than had been expected, based on the previous trend.
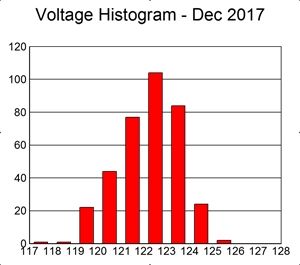
Here are some charts that illustrate the behaviour of the voltage at my home during December.
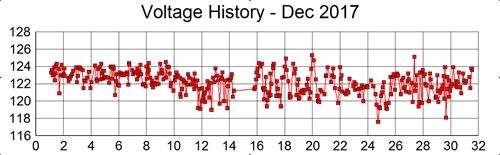
Some depression in voltage was probably due to the onset of very cold weather. Also, notice the short break in readings near mid-month when it was not possible to make any measurements.
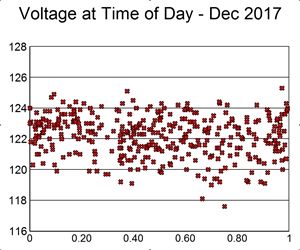
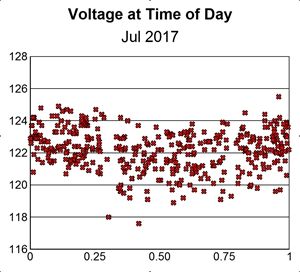
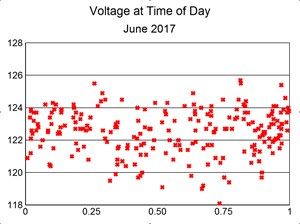
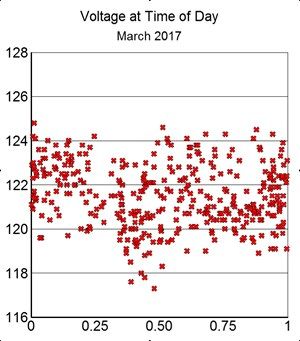
Below is a chart of the voltage displayed as a function of the time-of-day of the measurement. Midnight would be "0", noon would be "0.50" and the next midnight would be "1" day, so you can see how the voltage varies on average through a typical day during the month.
November 2017
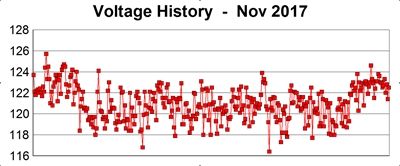
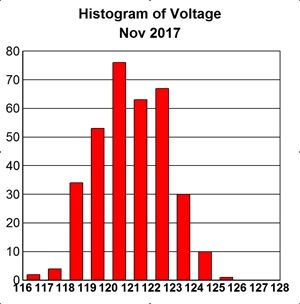
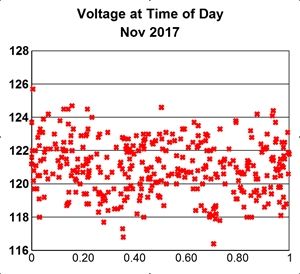
November 2017 was an unusual month with a power outage that resulted in our voltage being reduced to 120 VAC on average, followed two weeks later by a sudden increase in voltage to what it had been before the outage. Please see here for more specific details for November 2017.
The charts below were calculated with data for the entire month and therefore represent 3 different populations of voltage samples : before the outage, after the outage but before the "resumption" of higher voltage, and after the resumption. As a result, the histogram shows a bi-modal distribution in spite of there being over 300 samples, and the graph of voltage versus time of day is a spread-out mix of all three populations.
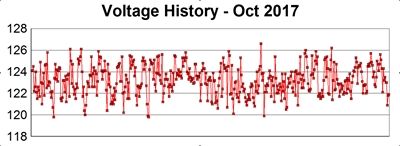
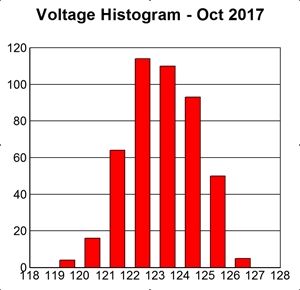
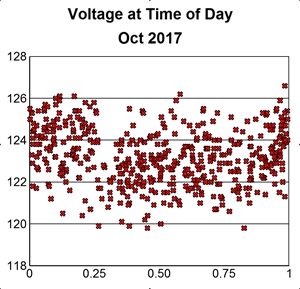
October 2017
The trend to a higher average voltage has continued for another month.
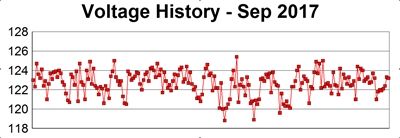
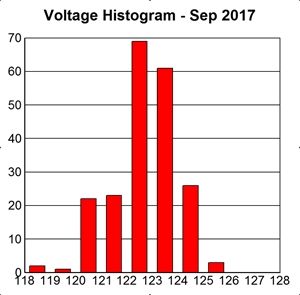
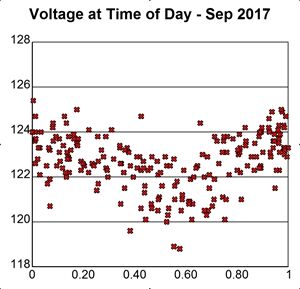
September 2017
The gradual upward trend in average voltage continued this month, and one could see signs of the supply system struggling to provide a stable voltage during the several periods of unseasonably high temperatures in the province which placed unusual demands on the electricity supply system. This is easily seen in the histogram of voltage supplied to my home.
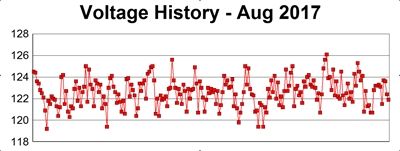
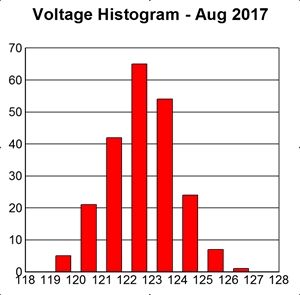
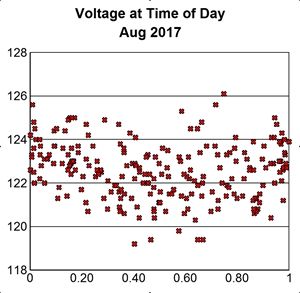
August 2017
A gradual upward trend continued this month with the average voltage around 122.6 VAC. This trend seems persistent and is, therefore, probably a result of Hydro One policy. It will be interesting to see if the trend reverses when cooler weather arrives.
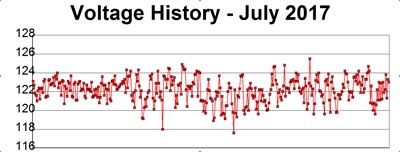
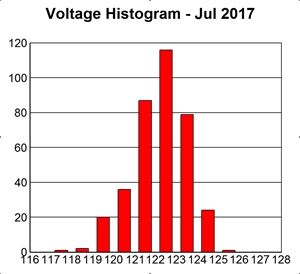
July 2017
Voltages at my home moderated somewhat during July, averaging about 122.1 VAC. Despite several spells of very warm weather, the range of voltages seen did not increase from previous months. The average voltage is still higher than I would prefer.
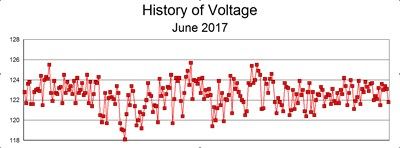
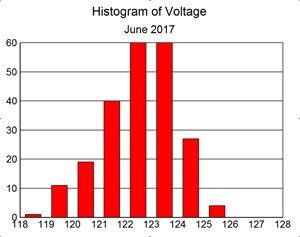
June 2017
Voltages were significantly higher this month than they have been, in fact, highest since the end of that terrible (voltage-wise) winter of 2015-16. The recent increases definitely look like a trend! See the summary chart on the summary page.
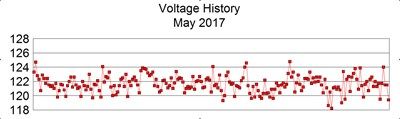
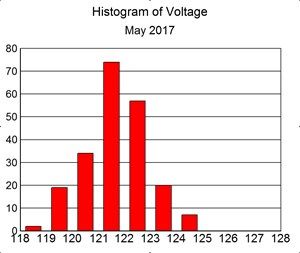
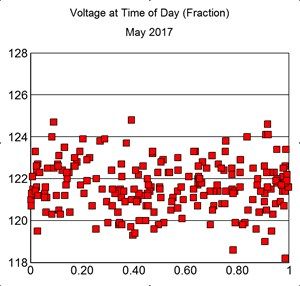
May 2017
Voltages seem a little higher this month. I hope it isn't the start of a trend.
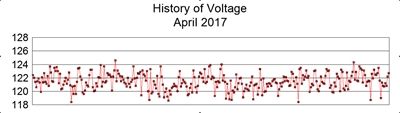
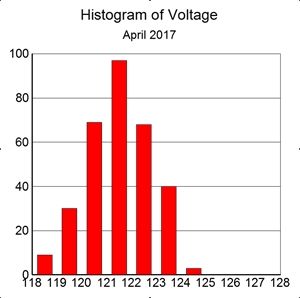
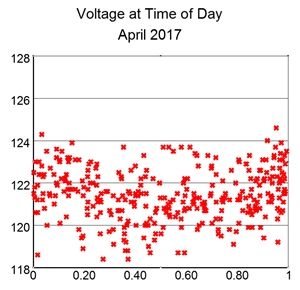
April 2017
Voltages during April were about the same as during March, helping to establish a definite levelling off of the voltage supplied by Hydro One. It will be interesting to see if this level of voltage can be maintained during the coming summer months when the system is stressed by the impacts of hot and humid weather.
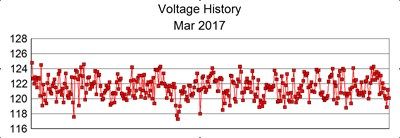
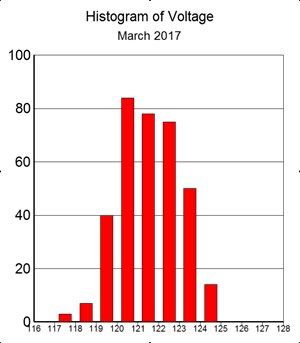
March 2017
March showed a slight relaxation in the trend to a higher average voltage and the average voltage seems now to be stable at a value between 121 and 122 VAC. Sure wish they had done this during the winter of 2015/16! As noted in February, the difference in voltage between day and night is much less now than before.
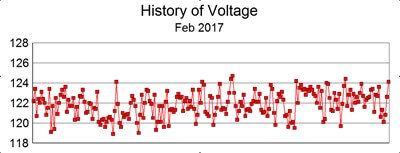
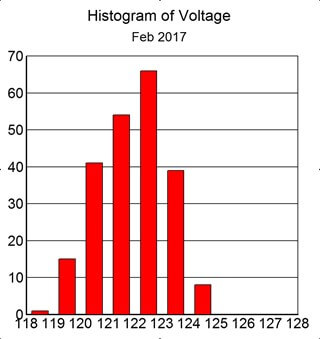
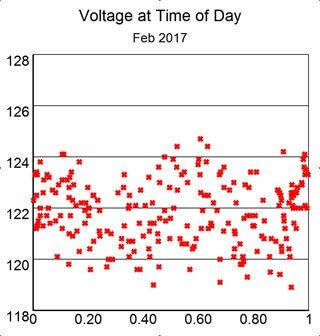
February 2017
February saw a continuation of the trend to rising voltages since last summer. The average voltage is still less than 122 VAC but not by much (121.86 VAC). I suppose that Hydro One hopes that I will become bored and stop watching them. (As a confirmed data junkie, I am unlikely to do that!). Curiously, the day/night difference is much less clear now than before (see the Time of Day scatter diagram).
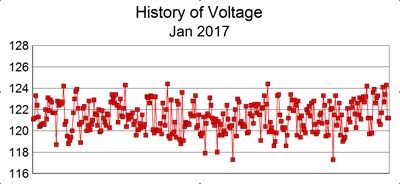
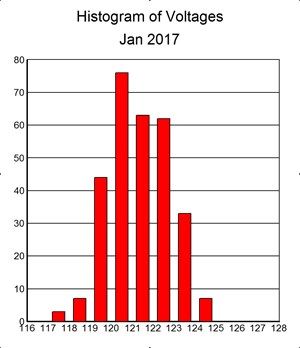
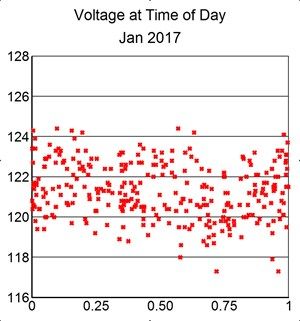
January 2017
Voltages observed during January 2017 were much better behaved than a year ago and were almost normal by comparison, averaging near 121 VAC instead of 124 VAC. Whether this was due to some new customer-friendly policy at Hydro One or was dictated by some technical circumstance of supply and demand, I do not know. Compare the three charts below with those for January 2016, further down.
Got Data?
If you have voltage measurements from your own neighbourhood and would like to share them, please contact me and I would be glad to exchange raw data and other results with you.