The Experiment
I took part in a radio experiment which was designed to observe any unusual effect on the earth's ionosphere which was caused by the passage of eclipse totality over the ionosphere between a high frequency (HF) radio transmitter and a distant receiver. My very small part in this experiment was to observe the precise frequency of a transmitter, Station WWV, located near Boulder, Colorado, USA, as received at my location about 2400 km to the east, hoping to detect any effect of the eclipse as it crossed the path between the transmitter and my location. Observations were carried out by all participants on two days : the day of the eclipse (21 August 2017) and the day before (20 August) to provide control data for comparison.
Data Obtained
Like the other participants, my data was uploaded to the HamSCI community at zenodo.org. Zenodo.org is a permanent, citable, centralized repository that is openly available to both researchers and the general public. I won't reproduce my data here as it is all available at zenodo.org.
Results
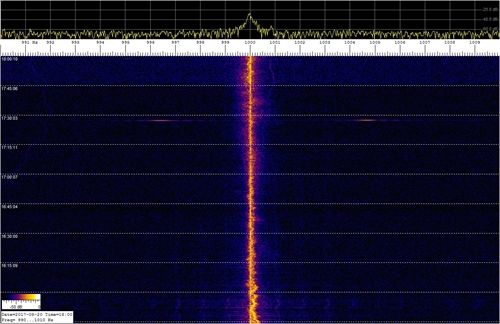
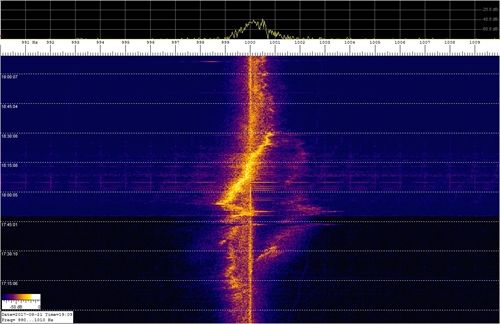
Below are a few diagrams showing a narrow-band spectrum of the distant signal from Station WWV on a frequency of 10.000 MHz on two days, 20, and 21 (eclipse day!) August 2017. What you see is a "waterfall" spectrum display with frequency increasing to the right on the horizontal axis and time flowing up from the bottom (bottom is old, top is most recent) on the vertical axis. The strength of the signal is represented by the brightness of the colour at that time and frequency. The time span is a little over 2 hours and the frequency span is ±10 Hz from the center frequency. The frequency measurements were made similar to my usual method, except that this time a much larger FFT sample size was used. The various lines and squiggles are different components of the received signal from the same transmitter which appear on slightly different frequencies. Without any propagation disturbance at all, the only component we should see would be a single, narrow, vertical line at 1000 Hz on the frequency scale. Obviously, this did not happen.

Day Before Eclipse (above) — Spectrum of WWV 10 MHz carrier
frequency on the day before the eclipse (20 Aug 2017), showing relatively undisturbed propagation.

During the Eclipse (above) — Spectrum of WWV 10 MHz carrier frequency during the solar eclipse, 21 Aug 2017, showing many disturbances.
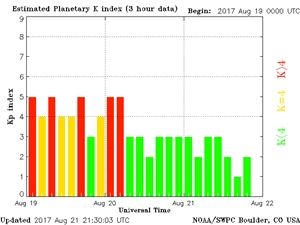
The state of the earth's magnetic field is also known to affect the condition of the ionosphere. For several days before the eclipse, the earth's magnetic field was disturbed by solar activity but geomagnetic conditions were fairly quiet on the day before the eclipse, as well as the day of the eclipse, 21 August 2017. A chart (below) of the earth's planetary K-index (Kp) shows this.

Planetary K index of magnetic activity (above) for 19-21 August 2017. (Thanks to U.S. National Oceanic and Atmospheric Administration.)
Conclusion
You can see the dramatic difference in the behaviour of the received 10 MHz carrier frequency between the day before the eclipse and the day of the eclipse. It seems that the radio wave traveled by several different paths through the ionosphere ("multi-path propagation"), each path being affected differently by the conditions along its path. These two, sometimes three, possibly four different paths are separated in frequency and displayed on the spectrogram as different fuzzy lines. The "real" and undisturbed signal from the transmitter is the sometimes-faint straight vertical line appearing at 1000 Hz on the display. The other components of the signal show deviations in frequency between zero and more than 2 hertz from the expected frequency.
It is reasonable to conclude that the disturbances to the carrier frequency shown here are due to shifts in height of the ionosphere and consequent Doppler shifting of the radio signal while the zone of eclipse totality passed over the path of the radio signal as it traveled from the transmitter in Colorado to my receiver in Ontario. It is well known that both the ionization density and the height of the ionosphere change as the level of solar illumination changes, that is, between sunlit and dark conditions.

